Human Factors Guidelines for Road Systems: Third Edition (2025)
Chapter: 10 Non-Signalized Intersections

ACCEPTABLE GAP DISTANCE
Introduction
Acceptable gap distance refers to the size of the gaps in major-road traffic typically accepted by drivers turning from a minor road onto a major road or crossing a major road that provides sufficient time for the minor-road vehicle to accelerate from a stop and complete a turn or crossing without unduly interfering with major-road traffic operations. A constant value of time gap, independent of approach speed, can be used for determining intersection sight distance (ISD) [see AASHTO (1)]. In particular, the ISD in both directions should be equal to the distance traveled at the design speed of the major road over the duration of the time gap.


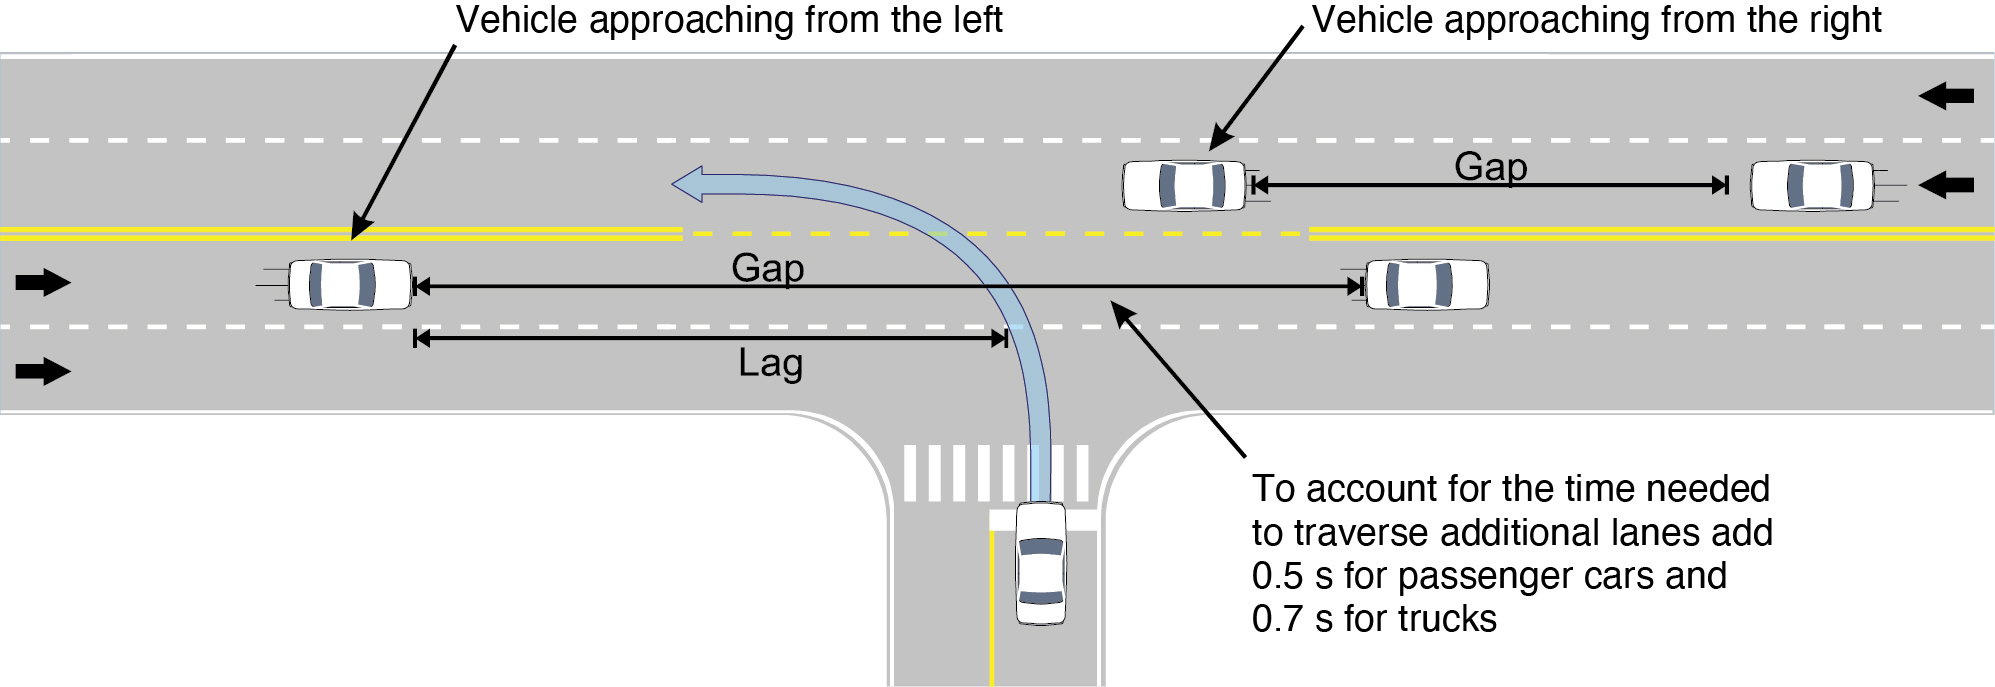
The figure below shows the different aspects of gap acceptance in a left-turn situation. Gaps are defined as the time interval between two successive vehicles, measured from the rear of a lead vehicle to the front of the following vehicle. Lags are defined as the time interval from the point of the observer to the arrival of the front of the next approaching vehicle.
Long Description.
Vehicles are approaching from the left toward the turn and vehicles are approaching from the right to the turn. There is a gap between two vehicles traveling on the left. An arrow that points to this gap reads, 'To account for the time needed to traverse the additional lanes, add 0.5 seconds for passenger cars and 0.7 seconds for trucks.'
Discussion
Gap acceptance distances that provide enough time to execute a traffic-crossing maneuver depend on the driverʼs ability to make accurate judgments of time available to cross. Chovan et al. (2) indicate that failure to accurately perceive and judge adequate gap distances can have serious safety consequences, and that two of the most common causal factors for left turn crashes are misjudged gap/velocity (30% to 36% of crashes) and drivers looked but did not see oncoming traffic (23% to 26% of crashes).
At short distances, where the size of the visual image (on the observerʼs retina) of the oncoming traffic is relatively large, time-to-arrival judgments may be made based on optical properties of the scene, such as the observed rapid expansion (“looming”) of the visual image as the object approaches [see, for example, Kiefer et al. (3)]. However, at the distances involved in roadway gap judgments, there is less agreement about whether these optical properties are as important or if other aspects, such as speed and distance judgments, dominate. In general, however, observers are not particularly adept at making judgments about arrival time, and they tend to underestimate this value by 20% to 40% (4). Fortunately, the degree of underestimation is reduced with higher oncoming vehicle speed and with longer viewing duration (4).
One study found that distance from the nearest oncoming vehicle was the best predictor of gap acceptance, while vehicle speed and time-to-arrival were weaker predictors (5). This finding suggests that drivers are somewhat insensitive to oncoming vehicle speed, which means that they may be more likely to accept smaller gaps if the speeds of oncoming vehicles are higher. In another study, driversʼ gap acceptance was more conservative when traffic was less intense, but they accepted shorter gaps and adopted less safe, more aggressive movements when traffic was more intense (6). No differences in gap acceptance were found between different numbers of lanes or the presence or absence of a left-turn lane, suggesting that the accepted gap was related to driversʼ feelings of time pressure and heightened arousal associated with maneuvering in high-intensity traffic rather than to road configuration.
The data for the acceptable gap distance guideline come from Harwood et al. (7), which measured critical gap for use as an intersection sight distance (ISD) criterion. For design purposes, the critical gap represents the gap between successive oncoming vehicles that average drivers will accept 50% of the time (and reject 50% of the time). The rationale for using critical gap as an ISD criterion is that if drivers will accept a specific critical gap in the major-road traffic stream when making a turning maneuver, then sufficient ISD should be provided to enable drivers to identify that critical gap.
Harwood et al. (7) found that drivers accept slightly shorter gaps for right turns than for left turns, and that heavy vehicles require longer gaps. Note, however, that other studies have not found a difference in gap acceptance size based on turn direction. In particular, one study found that passenger vehicle drivers accepted a critical gap of 6.5 s for both left and right turns; this source also reviewed comparable studies that also found mixed results regarding the effect of turn direction (8). Another factor that must be considered is the direction from which drivers face conflicting traffic. Left-turning drivers will accept shorter gaps if the gap they are evaluating involves a vehicle approaching from the left rather than from the right (9).
Design Considerations
Vehicles approaching a turning/crossing vehicle can be expected to slow down to avoid any potential conflicts; however, this deceleration may impact capacity on high-volume roadways. Harwood et al. (7) found that for turns executed with gaps of less than 10 s, oncoming vehicles decelerated from 0% to 80% with a median deceleration of 31% (average deceleration level was 0.68 m/s2). On average, two-thirds of the speed reduction occurs before the oncoming vehicle reaches the intersection. The average acceleration level of the turning vehicle was 1.46 m/s2.
Cross References
Determining Intersection Sight Distance
Factors Affecting Acceptable Gap
Key References
1. AASHTO. (2018). A Policy on Geometric Design of Highways and Streets (7th ed.). Washington, DC.
2. Chovan, J., Tijerina, L., Everson, J., Pierowicz, J., and Hendricks, D. (1994). Examination of Intersection, Left Turn Across Path Crashes and Potential IVHS Countermeasures (DOT HS 808 154). Washington, DC: NHTSA.
3. Kiefer, R. J., Cassar, M. T., Flannagan, C. A., Jerome, C. J., and Palmer, M. D. (2005). Surprise Braking Trials, Time-to-Collision Judgments, and “First Look” Maneuvers Under Realistic Rear-End Crash Scenarios (Forward Collision Warning Requirements Project, Tasks 2 and 3a Final Report, DOT HS 809 902). Washington, DC: NHTSA, Office of Advanced Safety Research.
4. Groeger, J. A. (2000). Understanding Driving: Applying Cognitive Psychology to a Complex Everyday Task. Hove, UK: Psychology Press.
5. Davis, G. A., and Swenson, T. (2004). Field study of gap acceptance by left-turning drivers. Transportation Research Record: Journal of the Transportation Research Board, 1899, 71–75.
6. Zhou, H., Ivan, J. N., Gårder, P. E., and Ravishanker, N. (2017). Gap acceptance for left turns from the major road at unsignalized intersections. Transport, 32(3), 252–261.
7. Harwood, D. W., Mason, J. M., Jr., and Brydia, R. E. (2000). Sight distance for stop-controlled intersections based on gap acceptance. Transportation Research Record: Journal of the Transportation Research Board, 1701, 32–41.
8. Fitzpatrick, K. (1991). Gaps accepted at stop-controlled intersections. Transportation Research Record: Journal of the Transportation Research Board, 1303, 103–112.
9. Kittelson, W. K., and Vandehey, M. A. (1991). Delay effects on driver gap acceptance characteristics at two-way stop-controlled intersections. Transportation Research Record, 1320, 154–159.
FACTORS AFFECTING ACCEPTABLE GAP
Introduction
The factors affecting acceptable gap refer to the driver, environment, and other situational factors that cause most drivers or specific groups of drivers (e.g., inexperienced or older drivers) to accept smaller or larger gaps than they would otherwise accept under normal conditions. These guidelines only apply when there is no center median or acceleration lane that provides shelter to the turning vehicle. Note that in this guideline, a hazard refers to any object, person, obstacle, or condition that requires the driver to change speed or maneuver to avoid a collision.

The table below shows the perceptual, cognitive, and psychomotor subtasks associated with the key activities that drivers must perform when making left or right turns across traffic in a four-lane roadway [adapted from Richard, Campbell, and Brown (8)].

Long Description.
The table has four columns: Row Column 1: Activity. Column 2: Perceptual Subtasks. Column 3: Cognitive Subtasks. Column 4: Psychomotor Subtasks Row 1. Column 1: Check for possible conflicts with following vehicle. Column 2: Visually assess trajectory of following vehicle. Column 3: Determine if distance and speed of vehicle indicate potential conflict. Column 4: Head and eye movements to observe rearview mirror. Row 2. Column 1: Check for pedestrians/cyclists crossing or about to cross in front. Column 2: Look left and right along crosswalk. Column 3: Determine if pedestrians/cyclists are present or likely to enter the crosswalk. Column 4: Head and eye movements for viewing. Row 3. Column 1: Advance into crosswalk. Column 2: Visually observe crosswalk. Column 3: Determine when vehicle is in appropriate position for turning. Column 4: Slowly accelerate and brake. Row 4. Column 1: Look for gap in perpendicular and crossing traffic. Column 2: Visually monitor traffic. Column 3: Determine distance and speed of oncoming traffic. Determine if gap is sufficient for turning. Column 4: Head and eye movements to monitor oncoming traffic. Row 5. Column 1 Check for oncoming vehicles in far lane changing to destination (conflicting) lane. Column 2: Monitor oncoming vehicles in far lane. Column 3: Determine if vehicle is about to change lanes (e.g., turn signal on, changing trajectory, etc.). Column 4: Head and eye movements to monitor oncoming traffic. Row 6. Column 1 Check for hazards in turn path. Column 2: Visually scan turn path (especially crosswalk) and intended lane. Column 3: Determine if any pedestrians/cyclists or other hazards are in the crosswalk or about to enter. Column 4: Head and eye movements to view turn path. Row 7. Column 1 Accelerate to initiate turn. Column 2: View roadway. Column 3: Determine that acceleration is sufficient to avoid conflicts with other vehicles. Column 4: Quickly accelerate. Head and eye movements. Row 8. Column 1: Steer into turn. Column 2: View turn path. Column 3: Determine that vehicle trajectory and lane position are appropriate. Column 4: Steering adjustments necessary to stay in lane.
Discussion
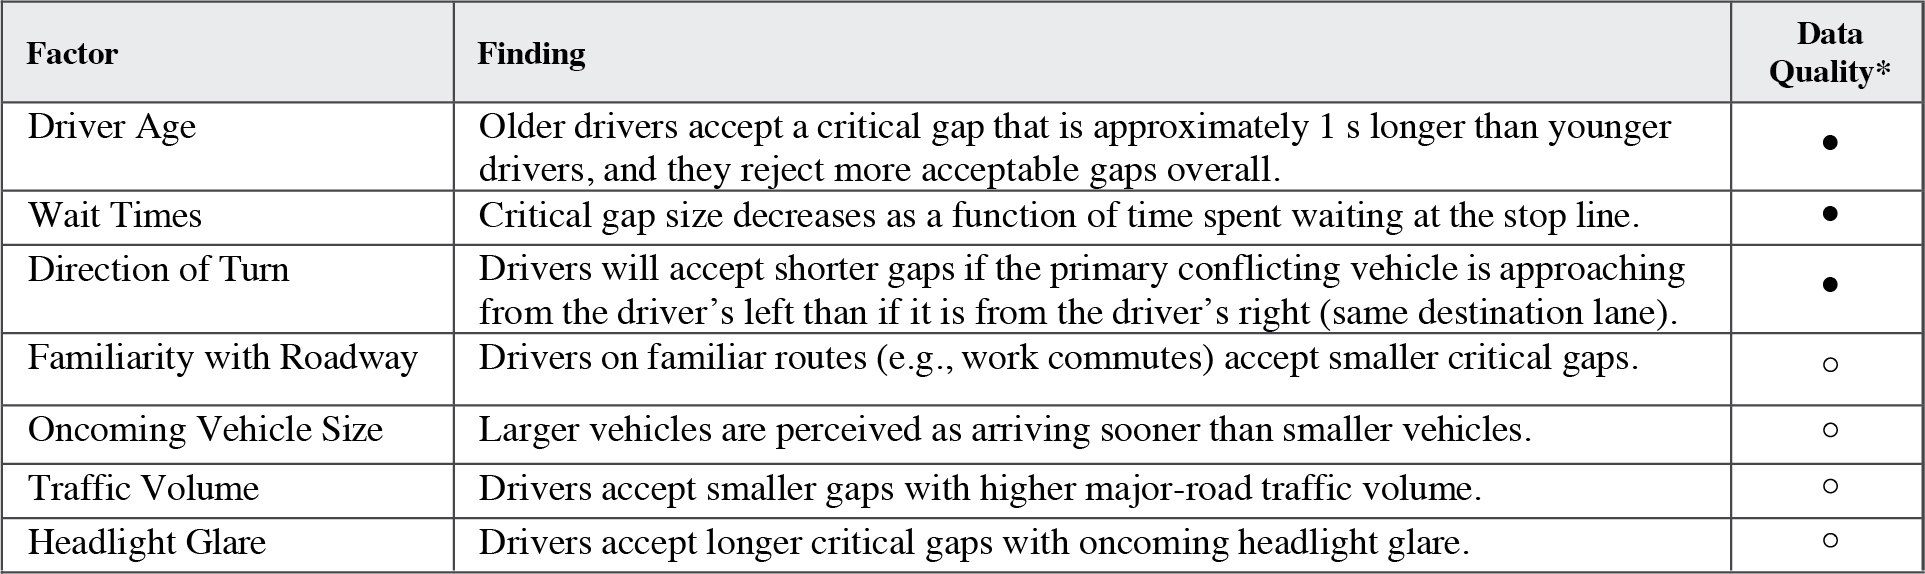
Driver age. Several studies have found that older and inexperienced drivers require gaps that are approximately 1 s longer than younger drivers. Some studies also find that older drivers tend to reject more usable gaps than other drivers, which leads to capacity reductions (1, 2). The data suggest that these differences likely reflect more cautious decision criteria (1). Yi (2) also found that older drivers require more time to enter and accelerate to the desired speed (10–13 s to reach 25 mi/h and 16–19 s to reach 35 mi/h compared to the respective 7–9 s and 12–14 s for younger drivers).
Wait times. Most vehicles that wait in a queue accept smaller gaps than those that do not wait (3). Also, the longer that drivers wait, the more likely they are to accept gaps that they previously rejected as being too short (4). Note that there is no information about whether this arises from increased driver frustration or from drivers learning through observation that smaller gaps are likely to provide adequate maneuvering time (3).
Direction of turn. Drivers accept shorter gaps if the primary other vehicle is approaching from the driverʼs left than if it is approaching from the driverʼs right (4, 5). For example, a driver making a left turn will accept a smaller gap from a vehicle approaching from the left (for which there will only be a conflict while the turning vehicle crosses its path), than one approaching from the right (for which there will be a potential conflict until the turning vehicle gets up to speed). If drivers are faced with a single vehicle coming in the conflicting direction, then some data suggest that drivers will accept shorter gaps while making right turns than left turns (6); however, there is also evidence that this difference is small or insignificant.
Familiarity with the roadway. Only one study considered the effects of driver familiarity on gap acceptance (5). This study found that drivers on regular commute trips generally accept smaller gaps, which seems to arise because drivers are familiar with what constitutes a gap that is adequate for completing a particular turning maneuver. Roadway type and condition, such as asphalt vs. gravel or dirt, or wet vs. dry conditions, may also impact driver behavior.
Oncoming vehicle size. Some driving simulator research indicates that larger vehicles are perceived as arriving sooner than smaller vehicles, even if their actual arrival time is the same (7). This finding may have implications for roadways with high motorcycle traffic, because drivers may overestimate the gap size for these smaller vehicles.
Traffic volume. Higher traffic volume on the major road appears to lead to drivers accepting smaller gaps (3). This situation could arise because large gaps are less common or drivers see the need to take whatever gap is available, even if it is smaller than what they would normally take.
Design Considerations
None.
Cross References
Determining Intersection Sight Distance
Key References
1. Lerner, N., Huey, R. W., McGee, H. W., and Sullivan, A. (1995). Older Driver Perception-Reaction Time for Intersection Sight Distance and Object Detection. Volume I, Final Report. (FHWA-RD-93-168). Washington, DC: FHWA.
2. Yi, P. (1996). Gap acceptance for elderly drivers on rural highways. Compendium of Technical Papers for the 66th ITE Annual Meeting, pp. 299–303. Washington, DC: ITE.
3. Kyte, M., Clemow, C., Mahfood, N., Lall, B. K., and Khisty, C. J. (1991). Capacity and delay characteristics of two-way stop-controlled intersections. Transportation Research Record: Journal of the Transportation Research Board, 1320, 160–167.
4. Kittelson, W. K., and Vandehey, M. A. (1991). Delay effects on driver gap acceptance characteristics at two-way stop-controlled intersections. Transportation Research Record: Journal of the Transportation Research Board, 1320, 154–159.
5. Hamed, M. M., Easa, S. M., and Batayneh, R. R. (1997). Disaggregate gap-acceptance model for unsignalized T-intersections. Journal of Transportation Engineering, 123(1), 36–42.
6. Harwood, D. W., Mason, J. M., and Brydia, R. E. (2000). Sight distance for stop-controlled intersections based on gap acceptance. Transportation Research Record: Journal of the Transportation Research Board, 1701, 32–41.
7. Caird, J., and Hancock, P. (1994). The perception of arrival time for different oncoming vehicles arriving at an intersection. Ecological Psychology, 6, 83–109.
8. Richard, C. M., Campbell, J. L., and Brown, J. L. (2006). Task Analysis of Intersection Driving Scenarios: Information Processing Bottlenecks. (FHWA-HRT-06-033). Washington, DC: FHWA.
LEFT-TURN LANES AT NON-SIGNALIZED INTERSECTIONS
Introduction
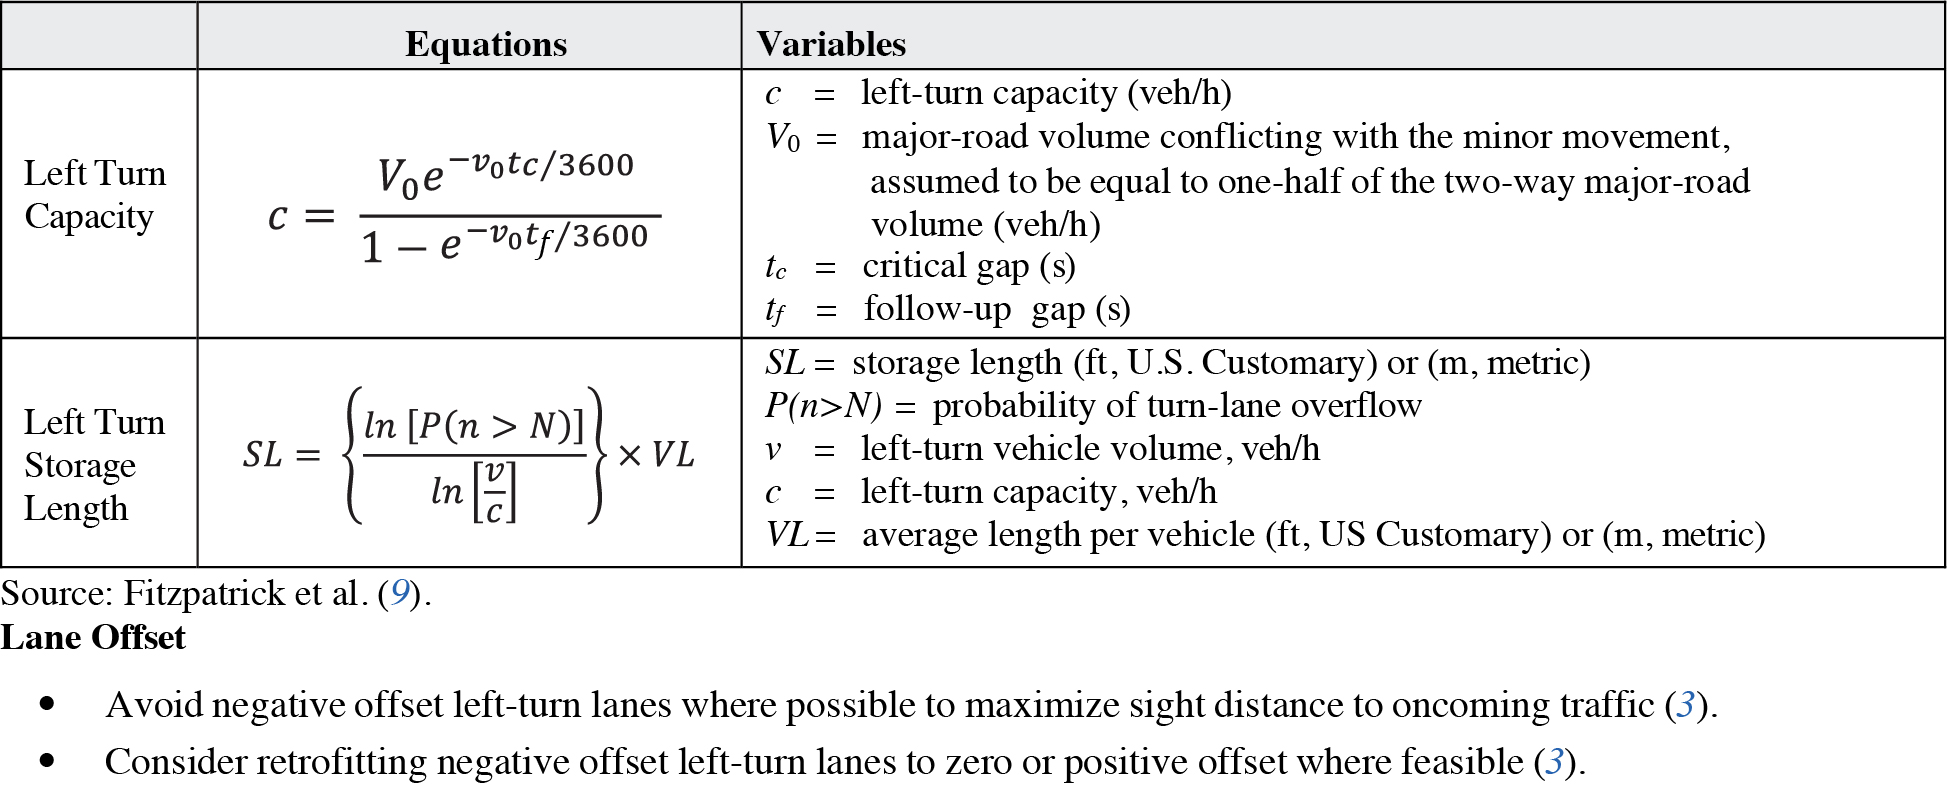
Left-turn lanes at non-signalized intersections are auxiliary lanes that minimize the impact of left-turning traffic on through traffic while reducing crash potential. Left-turn lanes are effective at reducing crashes and improving traffic flow at intersections because they route left-turning vehicles out of the through lane and provide space for them to decelerate and wait for a gap in traffic before turning. This guideline provides design guidance related to left-turn lane length, storage length, and lane offset.

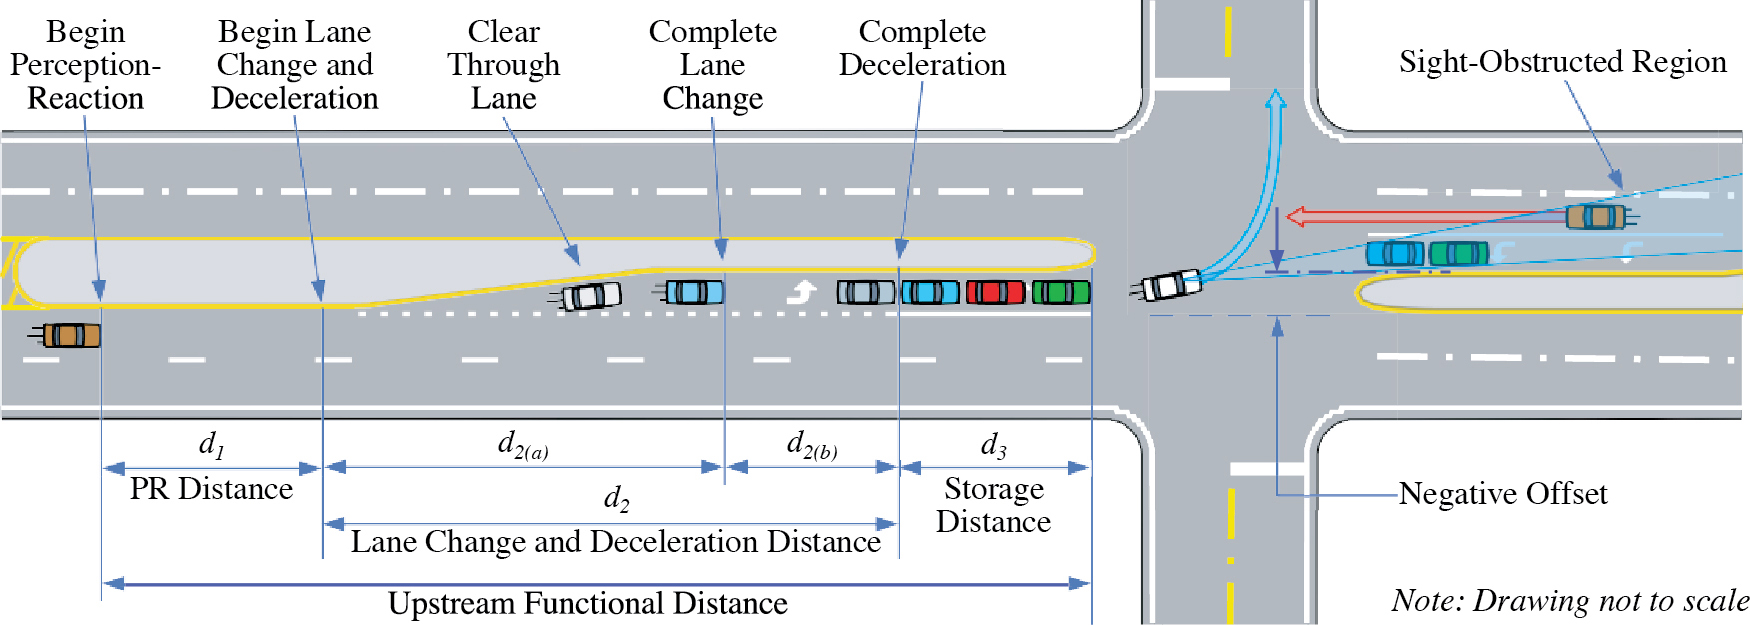
The figure below illustrates the components of a left-turn lane and left-turn maneuver on the major road at a non-signalized intersection. The figure also shows how a negative offset contributes to limited sight distance to oncoming vehicles due to obstruction by other vehicles in the oncoming left-turn lane. Use of zero or positive offset improves sight distance by reducing or eliminating such obstructions (3).
Source: Adapted from AASHTO (1) and Hutton et al. (3).
Long Description.
The illustration shows vehicles traveling from right to left. A vehicle enters the road from the left lane. Arrows label the following points on the road: begin perception reaction, begin lane change and deceleration, clear through lane, complete lane change, and complete deceleration. Additional arrows label the negative offset and sight-obstructed regions. The PR distance, lane change and deceleration distance, storage distance, and upstream functional distance are marked by double-headed arrows.
Discussion
Left-turn lanes provide both safety and performance benefits for left turns at intersections. Common reasons for considering installation of a left-turn lane include: speeds that are too high to make left turns safely, intersections with high crash occurrence involving left-turning vehicles (e.g., rear-end or sideswipe crashes as turning vehicles interact with through vehicles), large numbers of left-turn vehicles, and drivers having to wait a long time to make a left turn (4). Left-turn lanes provide a place for vehicles to wait outside of the through lane to make a left turn, which reduces the potential of exposure to rear-end crashes and reduces the impact to traffic flow in the through lane (2). In a study of 2,500 unsignalized intersections in Florida, rear-end crashes were the most dominant type of crashes for all intersection types except those with open medians and directional medians; rear-end crashes were the second most dominant crash type for intersections with those median types (5).
Lane Length. Effective left-turn lanes allow enough space for drivers to change into the left-turn lane and decelerate to a stop, with enough storage to accommodate the volume of vehicles waiting to turn. Insufficient lane length, however, can increase the potential for crashes. In an analysis of the safety effects associated with left-turn lane lengths at 52 intersections, lane length had a significant effect on crash potential (6). Median left-turn lanes with lengths consistent with AASHTO (7) recommendations for lane length experienced no crashes during the data collection period; however, crash frequency increased when left-turn lane lengths were shorter than the AASHTO (7) recommendations. A traffic simulation study had similar findings (2). An examination of historical crash data at the locations studied found that lanes that adhered to the AASHTO (7) recommendations for left-turn lane length generally exhibited appropriate safety performance, but shortening the lane length by 100 feet in traffic simulations at these intersections led to a 40 percent increase in crash likelihood (2). At locations where shorter lane lengths are required, engineering judgment and probability distributions should be used to evaluate the tradeoff between crash potential, crash severity, mobility, accessibility, economic impacts, and social impacts to determine if a short left-turn lane is appropriate (2, 6). Nevertheless, AASHTO (1) recommends that left-turn lanes be installed where justified, even if it is not practical to provide the full length for deceleration, because substantial crash reduction benefits are generally found when implementing left-turn lanes.
Offset. Left-turn lane offset can affect crash frequency at an intersection. A study of video recordings from forward- and rear-facing cameras in instrumented vehicles found that the view of oncoming traffic is obstructed more at left-turn lanes with negative offset than at those with zero or positive offset (3). This obstruction caused an increase in critical gap of 1.3 s at two-way stop-controlled intersections due to negative offset, leading to shorter accepted gaps compared to those accepted at zero- or positive-offset left-turn lanes. Hutton et al. (3) recommend that new intersection designs consider avoiding negative offset left-turn lanes and retrofitting negative offset left-turn lanes to zero or positive offset where feasible.
Design Considerations
At intersections with offset left-turn lanes, particularly those that might cause driver confusion or where visibility is reduced, MUTCD (8) guidance recommends that “dotted line extension markings consisting of 2-foot line segments and 2- to 6-foot gaps should be used to extend longitudinal line markings through an intersection or interchange area” (8).
Cross References
Factors Affecting Acceptable Gap
Key References
1. AASHTO. (2018). A Policy on Geometric Design of Highways and Streets (7th ed.). Washington, DC.
2. Qi, Y., Chen, X., Wang, Y., and Lu, Y. (2014). Left-Turn Lanes at Unsignalized Median Openings. Houston, TX: Texas Southern University.
3. Hutton, J. M., Bauer, K. M., Fees, C. A., and Smiley, A. (2015). Evaluation of left-turn lane offset using the naturalistic driving study data. Journal of Safety Research, 54, 5.e1-15.
4. Fitzpatrick, K., Brewer, M. A., Eisele, W. L., Levinson, H. S., Gluck, J. S., and Lorenz, M. R. (2013). NCHRP Report 745: Left-Turn Accommodations at Unsignalized Intersections. Transportation Research Board of the National Academies, Washington, DC.
5. Haleem, K., and Abdel-Aty, M. (2012). Association between access management and traffic safety: Median classification and spatial effect. ITE Journal, 82(4), pp. 22–27.
6. Chen, X., Qi, Y., and Lu, Y. (2014). Safety effects of using short left-turn lanes at unsignalized median openings. Transportation Research Record: Journal of the Transportation Research Board (2436), pp. 13–22.
7. AASHTO. (2011). A Policy on Geometric Design of Highways and Streets (6th ed.). Washington, DC.
8. FHWA. (2012). Manual on Uniform Traffic Control Devices for Streets and Highways. (2009 ed. with revision numbers 1 and 2 incorporated). Washington, DC.
9. Fitzpatrick, K., Brewer, M. A., Dorothy, P., and Park, E. S. (2014). NCHRP Report 780: Design Guidance for Intersection Auxiliary Lanes. Transportation Board of the National Academies, Washington, DC.
SIGHT DISTANCE AT LEFT-SKEWED INTERSECTIONS
Introduction
Sight distance at left-skewed intersections refers to the available sight distance to the driverʼs right side for a vehicle crossing a major road from a left-skewed minor road (where the acute angle is to the right of the vehicle). In left-skewed intersections, the driverʼs line of sight can be obstructed by parts of the driverʼs vehicle, such as the roof posts, door column, passenger-seat headrest, a panel aft of the door, or any attachments to the rear of the vehicle. These sightline restrictions can result in reduced sight distances because the driver cannot see as far down the intersecting road as with 90° intersections. AASHTO (1) recommends that intersection angles (IA) be no more than 15° from perpendicular (i.e., 75° to 105°). Note that earlier versions of the Green Book (1) allowed IA of 60° to 120°.
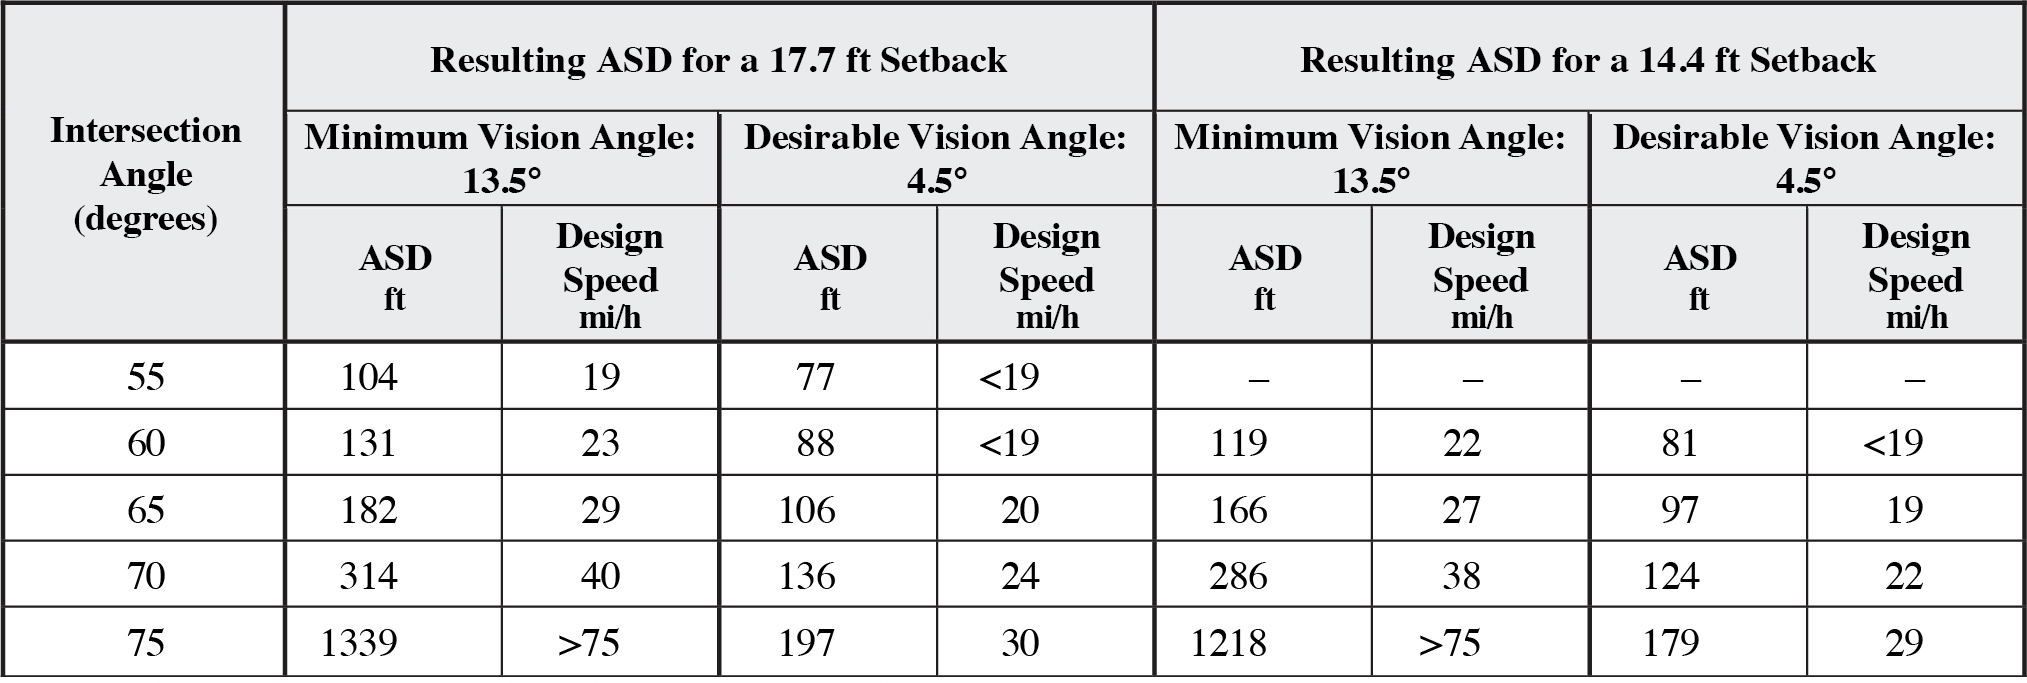
The guideline provides information about available sight distance (ASD) and the design speed that accommodates the ASD for different viewing/vision angles. Two different vision angle conditions are presented. The minimum vision angle indicates design parameters for the minimum recommended vision angle. The desirable vision angle provides more conservative recommended values that better accommodate larger vehicles and older drivers.

The figure below shows the variables and dimensions used to calculate the ASD and design speed values in the table.
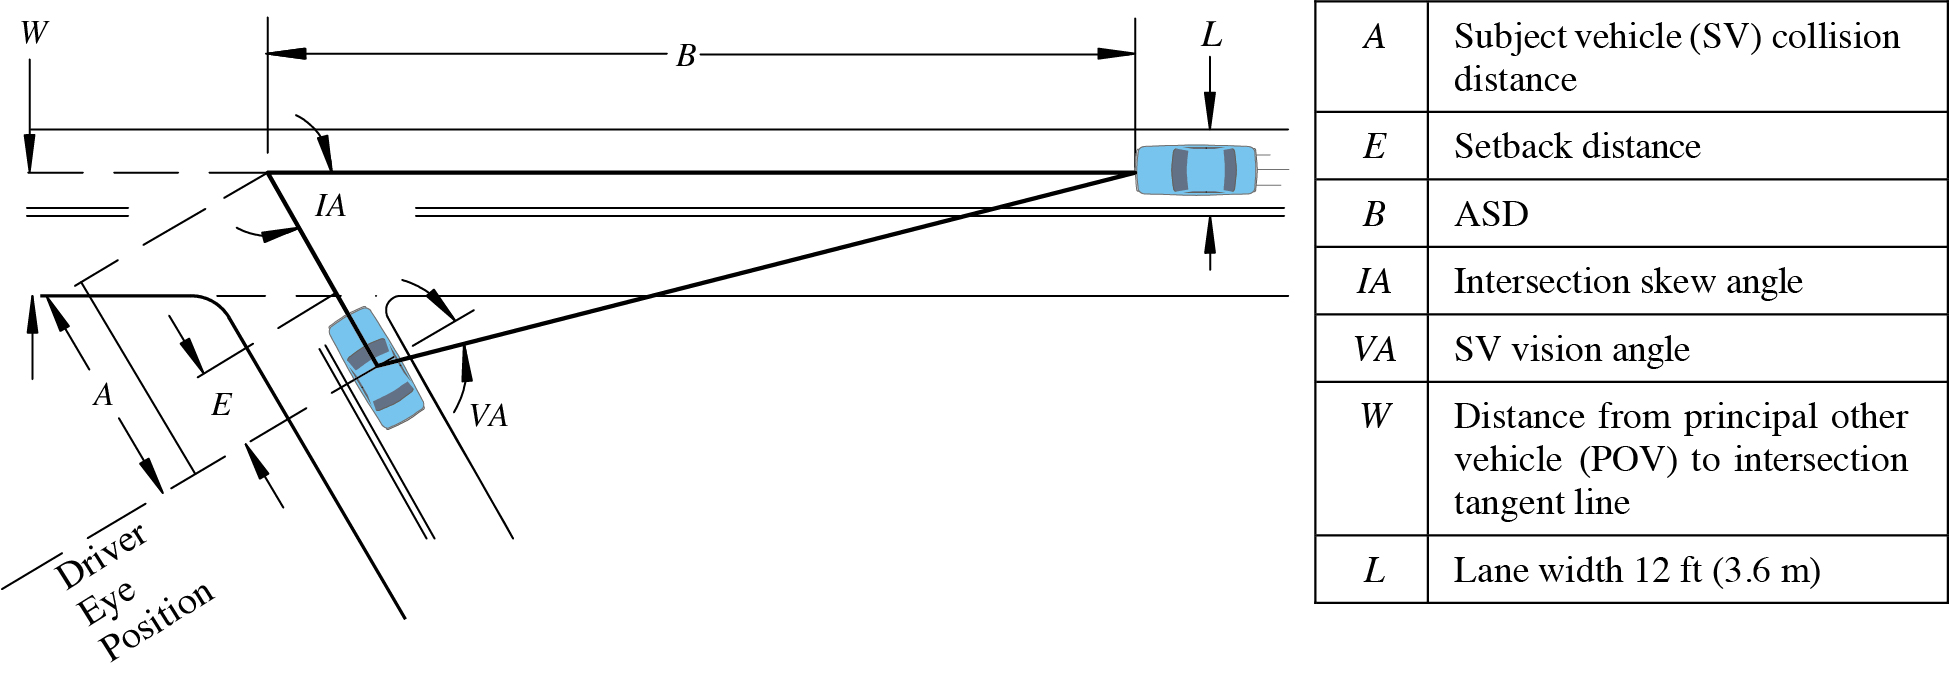
Long Description.
The driver's eye position and direction of vehicle movement are marked. Double-headed arrows mark regions of A, E, B, IA, VA, W, and L. A legend provides the definitions of the lettered symbols: A is Subject vehicle (SV) collision distance E is Setback distance B is ASD IA is Intersection skew angle VA is SV vision angle W is Distance from principal other vehicle (POV) to intersection tangent line L is Lane width 12 feet (3.6 meters)
Discussion
The available sight distances presented in the guideline are calculated based on drivers of restricted-vision vehicles viewing oncoming traffic backwards over their right shoulder. The 4.5° viewing-angle condition represents a driver sitting back fully against the seat, which represents the most restricted viewing-angle condition. Actual viewing angles from this position can range from around 2° in ambulances and motor homes to 7° or 8° in single-unit trucks and school buses. Viewing angles are typically more than 19° in all vehicles if drivers adopt an extreme “leaning forward” position in which their head is positioned almost directly above the steering wheel (2). The 13.5° viewing-angle condition used in the guideline represents an intermediate “leaning forward” driver posture that is between the “fully against the seat back” position and the “full forward” position. It was selected based on expert judgment of a review panel involved in the study and represents a reasonable approximation of how far forward most drivers could be expected to lean.
Son, Kim, and Lee (3) measured the available vision angle in three Korean design vehicles (passenger cars, single-unit trucks, and semi-trailers). The viewing angles in single-unit trucks and semi-trailers were 1.3° in the “seat back” position and 12.6° to 13.1° in the “full forward” position. However, viewing angles from a comfortable “leaning forward” position in these vehicles were 5.2° to 5.4°, which are smaller than the 13.5° viewing angle adopted for the guideline. Viewing angles for passenger cars were much greater, having values of 13.5° and 17° in the “seat back” and comfortable “leaning forward” positions, respectively.
It should be noted that some drivers, especially older drivers, may be restricted in their ability to lean forward because of limitations in their neck and trunk flexibility, and therefore the intermediate “leaning forward” position (13.5°) may be difficult to obtain. If the design must accommodate older drivers, use of the desirable vision angle may be more appropriate. See the guideline “Sight Distance at Right-Skewed Intersections” for additional discussion of this issue.
The design speed measure reported in the guideline is based on the time available for the vehicle on the major road to stop or avoid a conflict with the minor-road vehicle that entered the intersection late based on what its driver could see from the restricted viewing angle. Note that vehicles passing through skewed intersections also have a longer distance to traverse, which increases the driverʼs exposure to oncoming traffic.
The 17.7 ft (5.4 m) setback represents a conservative estimate for how far back the driverʼs eye position is from the edge of the major road. More specifically, it is based on the distance of 17.7 ft (5.4 m) measured from the minor-road vehicle driverʼs eye to the edge of the crossroad. This value is the recommended driver-position setback for intersection sight distance calculations (4). However, a setback distance of 14.4 ft (4.4 m) may also be used for constrained situations and is consistent with driver behavior in response to restricted sightline situations.
Design Considerations
To what extent the current recommendations apply to light trucks is uncertain at this point. Restricted rearward viewing may occur with light trucks because some lack a rear seating area with windows and some have truck bed attachments that can obscure the rearward view. Another design issue that impacts intersections in a significant way is how skew angle stretches out an intersection for vehicles to make left and right turns. Turning movements of a semi-trailer would require the stop bar to sit back 50–75 ft. In a 4-leg intersection, the left turn stop bars would also be set back further, which would lengthen the perception-reaction time (PRT).
Cross References
Determining Intersection Sight Distance
Sight Distance at Right-Skewed Intersections
Key References
1. AASHTO. (2018). A Policy on Geometric Design of Highways and Streets (7th ed.). Washington, DC.
2. Gattis, J. L. and Low, S. T. (1998). Intersection angle geometry and the driverʼs field of view. Transportation Research Record: Journal of the Transportation Research Board, 1612, 10–16.
3. Son, Y. T., Kim, S. G., and Lee, J. K. (2002). Methodology to calculate sight distance available to drivers at skewed intersections. Transportation Research Record: Journal of the Transportation Research Board, 1796, 41–47.
4. Harwood, D. W., Mason, J. M., Brydia, R. E., Pietrucha, M. T., and Gittings, G. L. (1996). NCHRP Report 383: Intersection Sight Distance. TRB, National Research Council, Washington, DC.
SIGHT DISTANCE AT RIGHT-SKEWED INTERSECTIONS
Introduction
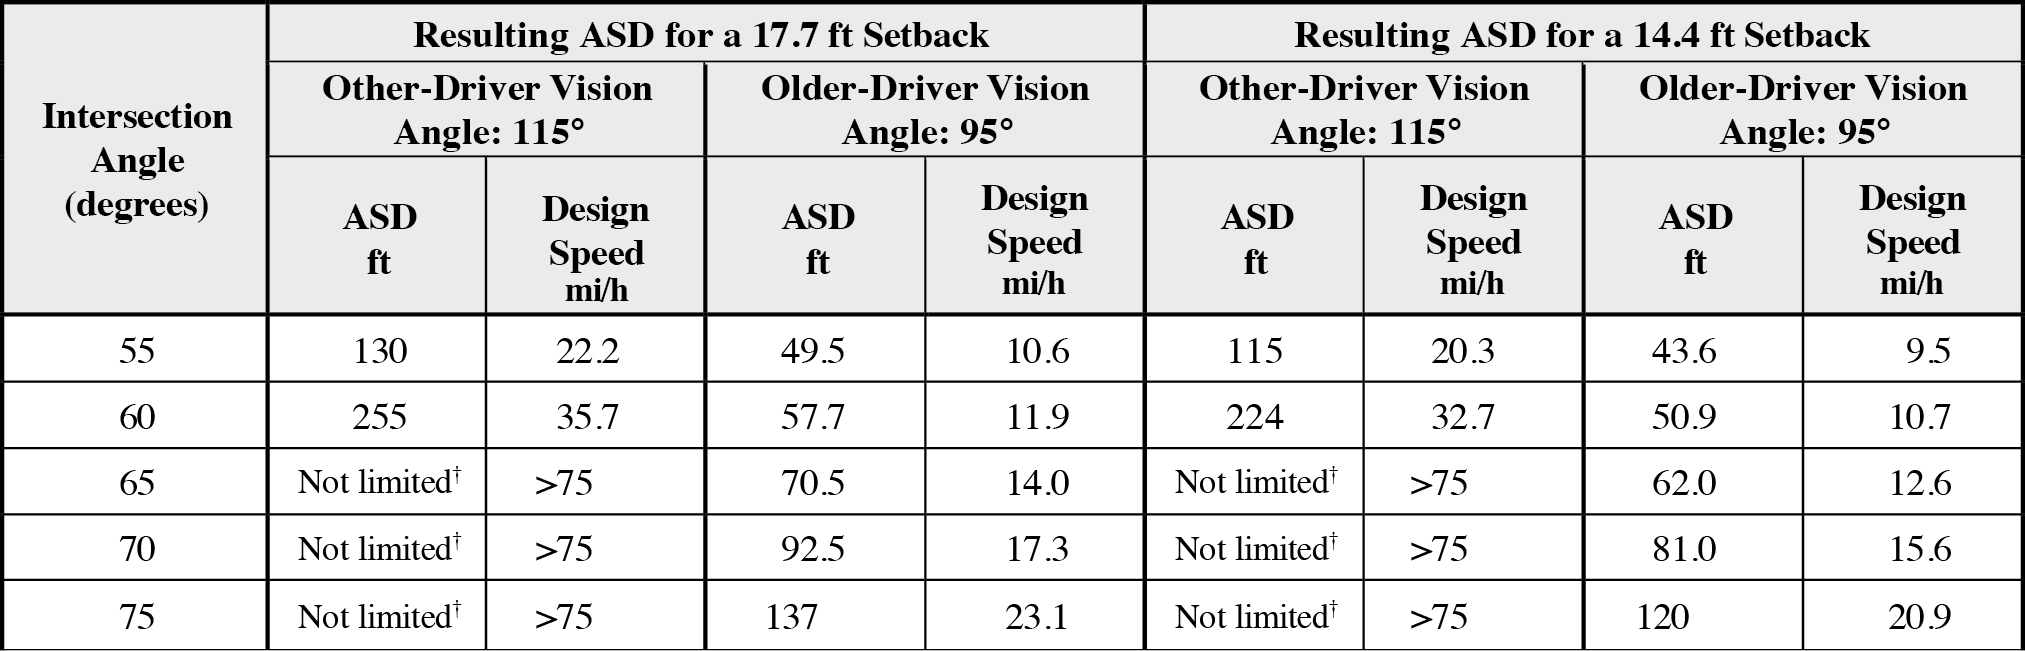
Sight distance at right-skewed intersections refers to the available sight distance (ASD) to the driverʼs left side for a vehicle crossing a major road from a right-skewed minor road (where the acute angle is to the left of the vehicle). In right-skewed intersections, the driversʼ line of sight over their left shoulder is not typically obstructed by parts of their vehicle, such as the case with left-skewed intersections. In contrast, the primary limitations to driversʼ line of sight are their ability to physically turn their body to the left and how far over their shoulder they can orient their gaze to view oncoming vehicles. These viewing limitations can result in reduced sight distances because the driver cannot see as far down the intersecting road as they could at a 90° intersection. The guideline provides recommendations for accommodating older drivers who are more likely to have neck and/or trunk movement restrictions, in addition to recommendations for drivers without such limitations (identified as “other drivers”).

The figure below shows the variables and dimensions used to calculate the ASD and design speed values used in the guideline table.
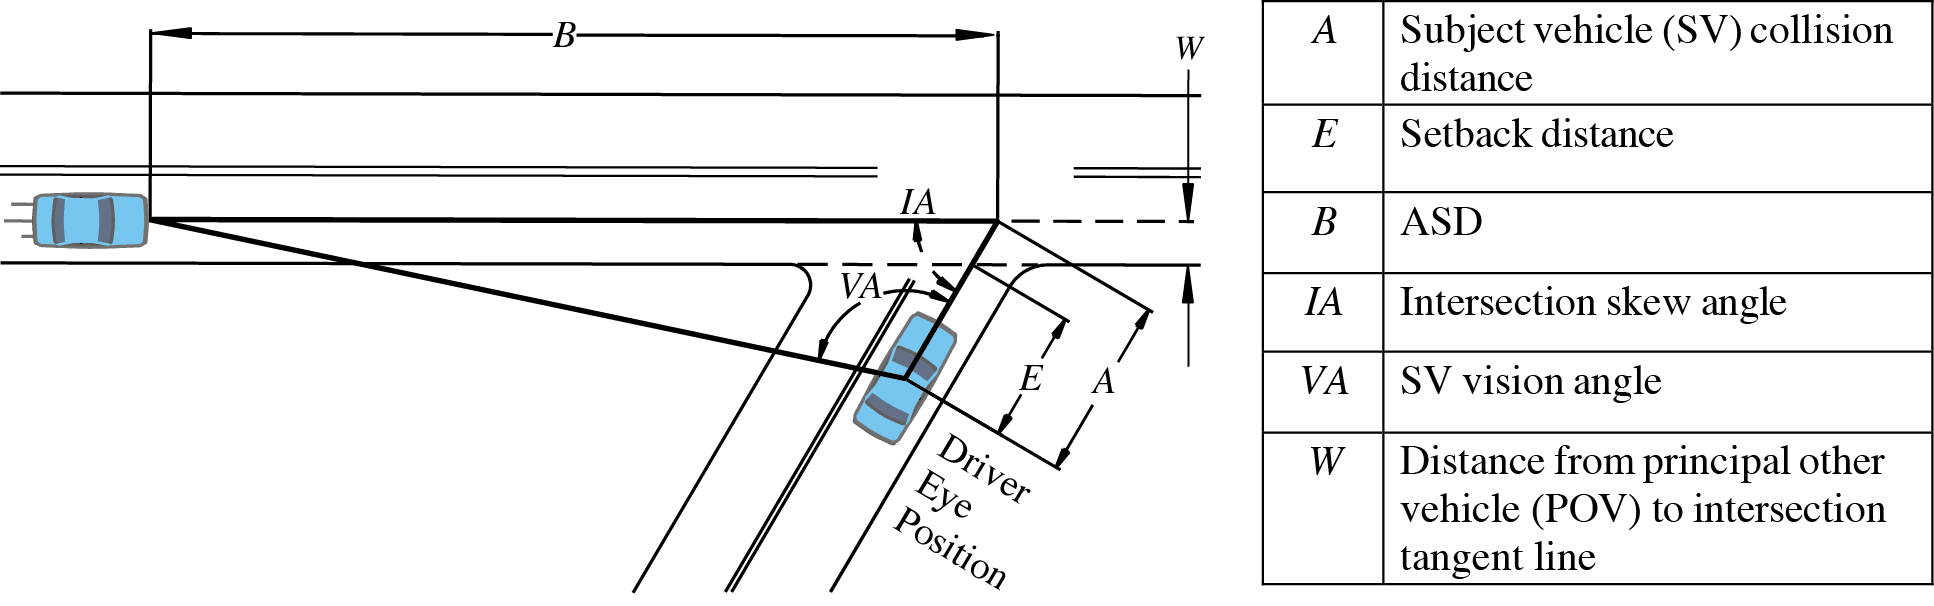
Long Description.
The driver's eye position is marked. Double-headed arrows mark regions of A, E, B, IA, VA, and W. A legend provides the definitions of the letters: A is Subject vehicle (SV) collision distance E is Setback distance B is ASDIA is Intersection skew angle VA is SV vision angle W is Distance from principal other vehicle (POV) to intersection tangent line
Discussion
The primary limiting factor for visibility with right-skewed intersections is the driversʼ direct field of view based on how far over their left shoulder they can see by turning their body, head, and eyes to the left. This visibility limitation contrasts with left-skewed intersections, in which parts of the vehicle body can obstruct the driversʼ view over their right shoulder regardless of how far they can see to the side. Difficulty with head turning was one of the most frequently mentioned concerns in older driver focus groups, and these drivers reported experiencing difficulty turning their heads at angles less than 90° to view traffic on intersecting roadways. Moreover, joint flexibility declines by an estimated 25% in older drivers because of arthritis, calcification of cartilage, and joint deterioration (1). Older driversʼ capabilities can be accommodated in the design using the table on the previous page.
The values in the guideline table provide estimated ASD and recommended design speed for oncoming vehicles based on approximations of how far to the left drivers on the minor road can be expected to see. The ASD and design speed values in the guideline table were computed using an analogous approach to the one taken in the guideline “Sight Distance at Left-Skewed Intersections,” which is based on Gattis and Low (2). Specifically, these terms represent the time available for a vehicle on the major road to stop or avoid a conflict with the minor-road vehicle that entered the intersection based on what its driver could see from the restricted viewing angle.
The minor-road driverʼs viewing angle is calculated using estimated trunk, head, and eye movement capabilities (vision angle) observed in healthy young and middle-aged drivers and healthy older drivers. For the other-driver vision angle, trunk, neck, and eye movement values of 30°, 70°, and 15° (totaling 115°) were used. For the older-driver vision angle, trunk, neck, and eye movement values of 25°, 55°, and 15° (totaling 95°) were used.
No data are currently available on trunk rotation range for seated drivers restrained by safety belts. The trunk rotation value used in the guideline calculations was based on an estimate of comfortable trunk rotation range for a restrained non-older driver of 30°, and then reduced by 5° to represent reduced flexibility in older drivers.
The neck rotation values are based on the study by Isler, Parsonson, and Hansson (3), which measured neck rotation to the left in seated drivers. In this study, 80% of drivers aged 59 years or younger had a neck movement range of 70° or more, while 75% of drivers aged 60 or older had a neck movement range of 55° or more. Note that these values are greater than those reported in another more comprehensive study of neck rotation, which found mean neck rotation to the left to be 65° in healthy people aged 20 to 59, and 54° in healthy people aged 60 to 79 (4).
The guideline table also assumes that drivers are able to execute at least one eye movement 15° toward the left. There are no data indicating how far drivers will move their eyes when making judgments about oncoming vehicle approaches; however, most naturally occurring eye movements (saccades) have an amplitude of 15° or less, and eye movements longer than this are effortful (5). While this 15° value may be considered as representing a conservative eye movement amplitude, many older drivers have limited peripheral vision, which would make it difficult to efficiently move their eyes farther out than 15° (5).
Design Considerations
The estimates of how far drivers can see to their left contain some degree of uncertainty because of the lack of reliable information on driver trunk rotation and eye movement amplitude.
Cross References
Determining Intersection Sight Distance
Sight Distance at Left-Skewed Intersections
Key References
1. Staplin, L., Lococo, K., Byington, S., and Harkey, D. (2001). Guidelines and Recommendations to Accommodate Older Drivers and Pedestrians. (FHWA-RD-01-051). McLean, VA: FHWA, Office of Safety R&D.
2. Gattis, J. L., and Low, S. T. (1998). Intersection angle geometry and the driverʼs field of view. Transportation Research Record: Journal of the Transportation Research Board, 1612, 10–16.
3. Isler, R. B., Parsonson, B. S., and Hansson, G. J. (1997) Age related effects of restricted head movements on the useful field of view of drivers. Accident Analysis and Prevention, 29(6), 793–801.
4. Youdas, J. W., Garrett, T. R., Suman, V. J., Bogard, C. L., Hallman, H. O., and Carey, J. R. (1992). Normal range of motion of the cervical spine: An initial goniometric study. Physical Therapy, 72(11), 770–80.
5. Bahill, A. T., Adler, D., and Stark, L. (1975). Most naturally occurring human saccades have magnitudes of 15 degrees or less. Investigative Ophthalmology, 14(6), 468–469.
This page intentionally left blank.


