Human Factors Guidelines for Road Systems: Third Edition (2025)
Chapter: 15 Special Considerations for Urban Environments

CHAPTER 15
Special Considerations for Urban Environments
Methods to Increase Driver Yielding at Uncontrolled Crosswalks
Methods to Increase Pedestrian Compliance at Uncontrolled Crosswalks
Methods to Reduce Driver Speeds in School Zones
Signage and Markings for High Occupancy Vehicle Lanes
Sight Distance Considerations for Urban Bus Stop Locations
General Design Considerations for Urban Bus Stops
It is crucial for the planner, designer, and engineer to consider the environment in which a roadway will be or is located. In this regard, the Green Book (AASHTO, 2018) uses the term “environment” to refer to “the totality of humankindʼs surroundings: social, physical, natural, and synthetic. It includes the human, animal, and plant communities and the forces that act on all three.” In particular, urban and rural environments may vary greatly with respect to the density and type of land use, the density and layout of roadways, and the numbers and demographics of their respective populations. The Green Book also notes that a roadwayʼs formal classification (e.g., as urban vs rural) may be different from the siteʼs actual conditions and features—it is therefore important for the designers to be working with the community early in the project planning process (AASHTO, 2018).
METHODS TO INCREASE DRIVER YIELDING AT UNCONTROLLED CROSSWALKS
Introduction
This guideline provides an overview of some methods that can be used to increase driver yielding at uncontrolled crosswalks. Uncontrolled crosswalks are crosswalks that cross the roadway at a location where no stop or signal control exists. They may be midblock or at an intersection with two-way traffic control. Uncontrolled crosswalks include those which have pedestrian signals such as a half signal or HAWK signal. These crosswalks are often desirable to improve pedestrian access to points that lie between, and perhaps far from, an associated controlled intersection crossing. However, at uncontrolled locations on two-lane roads, marked crosswalks provide no crash rate reduction when compared to unmarked crosswalks (1). Although pedestrians in marked crosswalks are more likely to have drivers immediately yield to them, this higher rate of yielding may lead to multiple-threat collisions on roadways with multiple lanes in each direction (2). Therefore, designers can provide pedestrians using marked crosswalks and drivers approaching marked crosswalks with sight lines that support timely and effective visual searches of the environment.

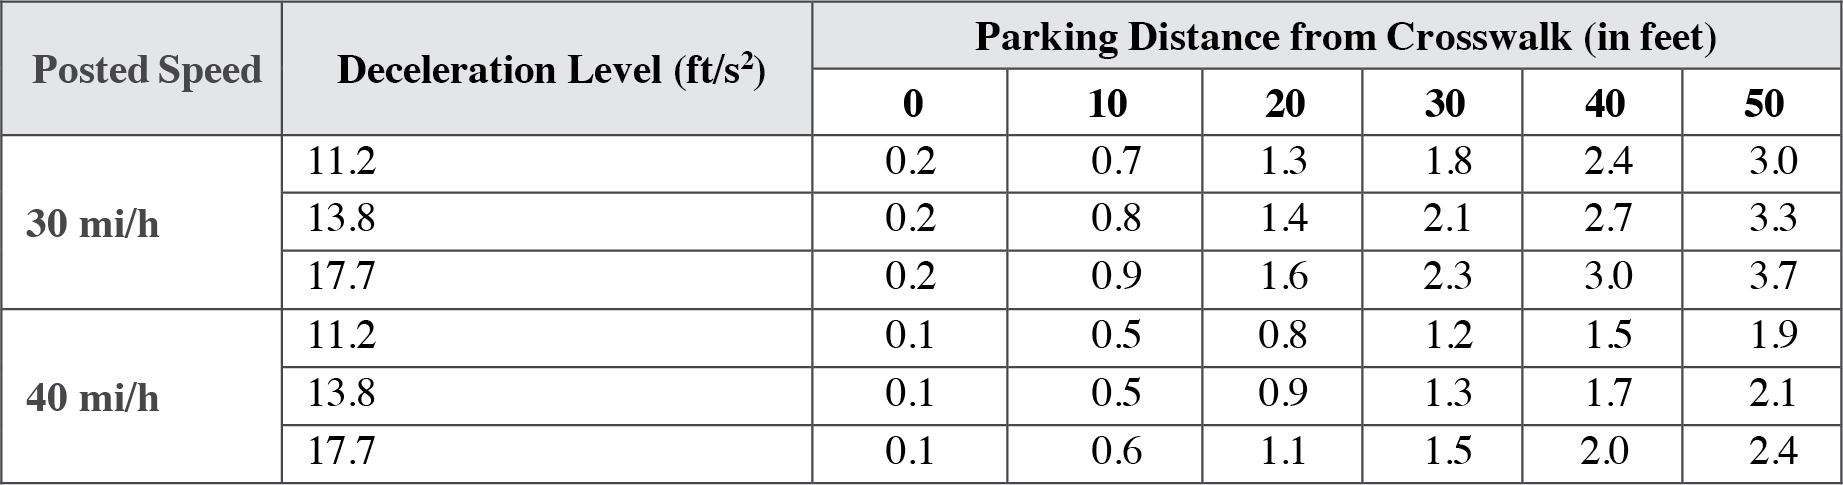
The width of the bulbout (in feet) that can be seen from the nearest travel lane at the stopping sight distance from the yield line is shown in the table below, which shows pedestrian visibility is extremely small at all speeds and parking distances from the crosswalk.
Long Description.
The table has 2 columns. Column 1: Deceleration Level in feet per second squared; Columns 2 to 7 list the following parking distances from crosswalk in feet: Column 2: 0, Column 3: 10, Column 4: 20, Column 5: 30, Column 6: 40, Column 7: 50. The first 3 rows are grouped together in a section for a posted speed of 30 miles per hour and have the following data: Row 1: 11.2 0.2 0.7 1.3 1.8 2.4 3.0 Row 2: 13.8 0.2 0.8 1.4 2.1 2.7 3.3 Row 3: 17.7 0.2 0.9 1.6 2.3 3.0 3.7 Rows 4 to 6 are grouped together in a section for posted speed of 40 miles per hour and have the following data: Row 4: 11.2 0.1 0.5 0.8 1.2 1.5 1.9 Row 5: 13.8 0.1 0.5 0.9 1.3 1.7 2.1 Row 6: 17.7 0.1 0.6 1.1 1.5 2.0 2.4
Assumptions: Driver eye is at the midpoint of the left half of the vehicle; the roadway is straight; the pedestrian stands in the middle of the bulbout (when looked at along the axis of the roadway); perception-response time is 1.6 s; vehicles are parked 1 ft from the curb; deceleration levels are from AASHTO (3) “comfortable” level (3.4 m/s2); vehicles in the parking lane are parked up to the yield line but not between the yield line and the crosswalk.
Discussion
Improve sight lines. The desired driver action at an uncontrolled crosswalk varies based on the presence or absence of a pedestrian. In a field study of midblock crosswalks, the addition of yield lines and “Yield to Pedestrians” signs increased the likelihood that drivers look to the right for crossing pedestrians (4). For drivers who yielded, the treatments also led to an increase in the distance between the vehicle and the crossing pedestrian. However, the proportion of drivers who yielded only increased with the addition of the treatments when the sight distance supported visibility to pedestrians.
Without improvements in sight distance, drivers with advance yield markings are unable to see pedestrians in their peripheral vision due to cars parked in the parking lane. Garay-Vega et al. (4) suggest that this situation is comparable to that which causes multiple-threat collisions. These collisions occur when the pedestrian enters traffic in front of a stopped vehicle and collides with another vehicle traveling in the same direction in a lane past the stopped vehicle.
Design Considerations
The issue of whether to mark the crosswalk is controversial. Zegeer et al. (1) found that multiple-threat collisions are much more likely to occur at marked crosswalks. However, in a study of marked and unmarked matched pairs of crosswalks, Ragland and Mitman (2) found that pedestrians in marked crosswalks were more likely to have drivers immediately yield to them, although when asked, significantly fewer drivers than pedestrians knew that pedestrians legally have the right-of-way at marked midblock crosswalks (44% to 74%, respectively). It is hypothesized that pedestrians exhibit an ordinary level of caution in marked crosswalks because they know drivers must yield to them, and/or their experience has taught them that more drivers are likely to yield. However, in unmarked midblock crosswalks, 72% of drivers and 76% of pedestrians knew that pedestrians did not have the right-of-way. It would be reasonable to assume that pedestrians would exhibit greater caution in crossing under these conditions, either because they know that they do not have the right-of-way or because their experience has been that drivers will not yield. Indeed, in the unmarked crosswalks, pedestrians waited for larger gaps (5/6 sites) and moved at a faster pace (4/6 sites) than in the marked crosswalks.
Even with the installation of bulbouts and the recommended parking restrictions, pedestrians may not be able to be seen by drivers, depending on the part of the bulbout on which they stand. Fitzpatrick et al. (5) list the body depth for standing area calculations as approximately 1.6 ft. The table on the previous page shows the width of the bulbout (perpendicular to the traveled way) that can be seen by drivers passing in the nearest lane. Though the MUTCD (6) guidance recommends that yield or stop lines be installed 20 to 50 ft in advance of the nearest crosswalk line, the inclusion of the 0-ft and 10-ft parking distances simulate multiple-threat crash scenarios where vehicles may stop right next to the crossing pedestrian. The bulbout widths would decrease if vehicles wider than 7 ft parked near the curb. Pedestrians may not feel comfortable standing right on the edge of the bulbout, especially those using wheelchairs or other assistive devices.
Cross References
Human Factors Considerations in Traffic Control Device Selection at Rail-Highway Grade Crossings
Methods to Increase Pedestrian Compliance at Uncontrolled Crosswalks
Methods to Reduce Driver Speeds in School Zones
Key References
1. Zegeer, C. V., Stewart, J. R., Huang, H. H., Lagerwey, P. A., Feaganes, J., and Campbell, B. J. (2005). Safety Effects of Marked versus Unmarked Crosswalks at Uncontrolled Locations: Final Report and Recommended Guidelines. (FHWA-HRT-04-100). McLean, VA: FHWA.
2. Ragland, D. R. and Mitman, M. F. (2008). Driver/Pedestrian Understanding and Behavior at Marked and Unmarked Crosswalks (UCB-ITS-TSC-2008-10). Berkeley: University of California Traffic Safety Center.
3. AASHTO. (2018). A Policy on Geometric Design of Highways and Streets (7th ed.). Washington, DC.
4. Garay-Vega, L., Fisher, D. L., and Knodler, M. A. (2008). Driversʼ performance in response to sight-limited crash scenarios at midblock crosswalks: Evaluation of advance yield markings and symbolic signage. Proceedings of the Human Factors and Ergonomics Society 52nd Annual Meeting, 1835–1839.
5. Fitzpatrick, K., Turner, S. M., Brewer, M., Carlson, P. J., Ullman, B., Trout, N., Park, E. S., Whitacre, J., Lalani, N., and Lord, D. (2006). TCRP Report 112/NCHRP Report 562: Improving Pedestrian Safety at Unsignalized Crossings. Transportation Research Board of the National Academies, Washington, DC.
6. FHWA. (2023). Manual on Uniform Traffic Control Devices for Streets and Highways. (11th ed.). Washington, DC.
METHODS TO INCREASE PEDESTRIAN COMPLIANCE AT UNCONTROLLED CROSSWALKS
Introduction
This guideline provides treatments that can promote safer pedestrian behavior and increased use of crosswalks. These treatments can reduce crash potential without decreasing crosswalk use and without excessive pedestrian delay. It is also important that they are designed so that pedestrians will find the treatments to be beneficial and thus use them as necessary. The following guideline describes the information needs of drivers at uncontrolled crosswalks. These needs should be provided for by using the appropriate engineering countermeasures, roadway design treatments, and traffic control devices. Note that not all of the potential treatments suggested below are warranted on all road types based on vehicular and pedestrian traffic volumes.

COMPLIANCE WITH VARIOUS TREATMENTS AT UNCONTROLLED CROSSWALKS
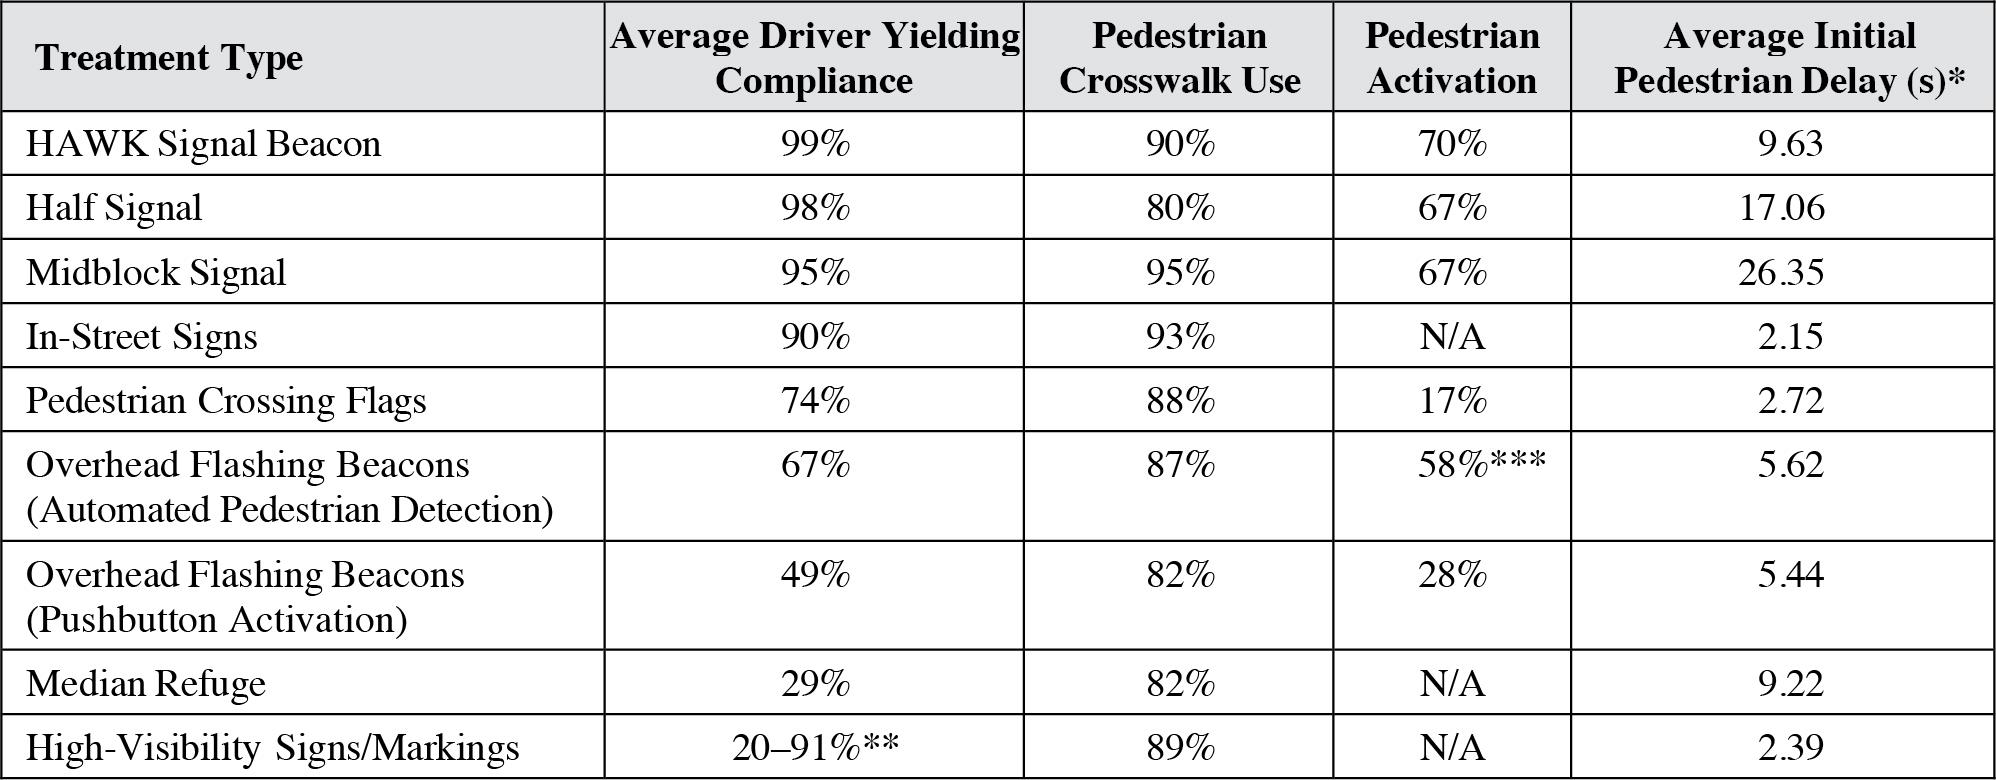
*Combined delay at start of crosswalk and in median.
**Average compliance lower on 35 mi/h roadways than 25 mi/h roadways.
***Reasons the system did not activate include: detector malfunctions, missed detections, and crosswalk noncompliance.
Source: Fitzpatrick et al. (1).
Long Description.
The table has 5 columns: Column 1: Treatment Type. Column 2: Average Driver Yielding Compliance. Column 3: Pedestrian Crosswalk Use. Column 4: Pedestrian Activation. Column 5: Average Initial Pedestrian Delay in seconds. Note for Column 5: This value is the combined delay at start of crosswalk and in median. The data are as follows: Row 1: HAWK Signal Beacon; 99%; 90%; 70%; 9.63 Row 2: Half Signal; 98%; 80%; 67%; 17.06 Row 3: Midblock Signal; 95%; 95%; 67%; 26.35 Row 4: In-Street Signs; 90%; 93%; N/A; 2.15 Row 5: Pedestrian Crossing Flags; 74%; 88%; 17%; 2.72 Row 6: Overhead Flashing Beacons (Automated Pedestrian Detection); 67%; 87%; 58%, note that reasons the system did not activate include: detector malfunctions, missed detections, and crosswalk noncompliance; 5.62 Row 7: Overhead Flashing Beacons (Pushbutton Activation); 49%; 82%; 28%; 5.44 Row 8: Median Refuge; 29%; 82%; N/A; 9.22 Row 9: High-Visibility Signs/Markings; 20–91%, note that the average compliance is lower on 35 miles per hour roadways than on 25 miles per hour roadways; 89%; N/A; 2.39
EXAMPLE TREATMENTS
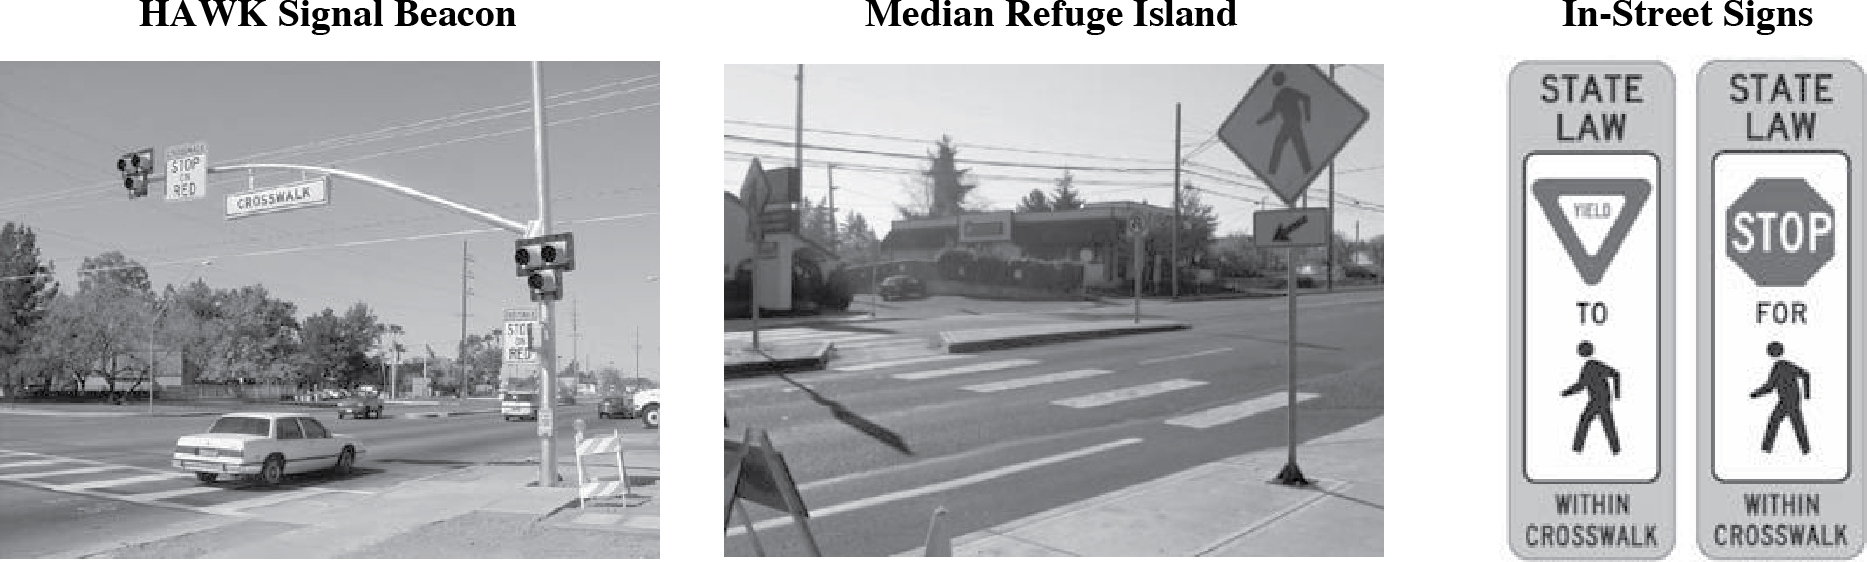
Source: Fitzpatrick et al. (1).
Discussion
Median refuge islands. When median refuges were installed, significant numbers of pedestrians used them for crossing (36–46%, 2). These percentages increased even more with the addition of crosswalks and yield bars. Providing a pedestrian refuge decreases near-side gap rejection (3) and allows pedestrians to cross the roadway in two stages.
Another type of median is the extended median, sometimes used at split midblock signals. With this type of median, delay to vehicles is reduced by requiring the pedestrian to activate the signal for one-half of the street, cross to the median, walk 100 ft down the center median, and push another button to activate the signal on the other half of the street. In an on-street survey, Ullman et al. (4) found that pedestrian opinions of extended medians varied based on the pedestriansʼ abilities. At the location with a greater number of disabled and older pedestrians, the extended median was viewed more favorably than at the location without this pedestrian population, where it was seen as an unnecessary delay.
Pedestrian signal response time. Van Houten et al. (5) studied two signalized midblock crosswalks in Miami, Florida, by varying the minimum green time of the oncoming vehicles to 30, 60, and 120 s. It was found that the percentage of pedestrians who violated the “Donʼt Walk” signal was greater at both intersections when the 60- or 120-s minimum green times were used. Proportionately more pedestrians violated the signal at 120 s than at 60 s. As the length of the minimum green time increased, more pedestrians were trapped in the crosswalk (23% at 120 s). When the minimum green time was short, most pedestrians waited for the “Walk” sign, decreasing their likelihood of becoming trapped. However, when the minimum green time was 30 s, the vehicle delay was longer than the pedestrian delay. Additionally, increasing the pedestrian clearance time to allow slower pedestrians to cross may cause longer minimum green times and thus increase pedestrian violations. FHWA (6) recommends an almost immediate response to pedestrian activation to encourage compliance.
Using on-street pedestrian surveys, Ullman et al. (4) found that about 75% of participants at six sites stated that they should have to wait less than a minute before being able to cross the street. However, this value may differ when examined as actual pedestrian actions. A short response time to pedestrian button pushing is important because if pedestrians push the button and do not get a fast response, they may cross at the first ample gap (depending on traffic levels). Then, when the signal turns red for drivers, no pedestrians will be crossing, possibly encouraging driver disrespect for the signal in the future (6).
Provide a clear indication of the required driver action. The red signals and beacons form a class of warning devices that clearly signify the required driver action. Fitzpatrick et al. (1) found that red signal treatments had compliance rates above 94%. The treatments that showed a red indication had a statistically higher compliance rate than those that did not. It was hypothesized that this is because they send a clear message to “Stop.” Nearly all of these devices were tested on busy, high-speed arterials (1).
Design Considerations
Fluorescent yellow-green is presented in the MUTCD (7) as a color option for some pedestrian crossing signs.
A potential issue is pedestrians congregating on the sidewalk near midblock crosswalks. If uncontrolled crosswalks are installed near locations where groups of pedestrians stand to socialize or wait for the bus, it may be more difficult for passing drivers to notice a pedestrian who is waiting to cross against the background of all of the stationary pedestrians.
Cross References
Countermeasures for Improving Accessibility for Visually Impaired Pedestrians at Roundabouts
Methods to Increase Driver Yielding at Uncontrolled Crosswalks
Key References
1. Fitzpatrick, K., Turner, S. M., Brewer, M., Carlson, P. J., Ullman, B., Trout, N., Park, E. S., Whitacre, J., Lalani, N., and Lord, D. (2006). TCRP Report 112/NCHRP Report 562: Improving Pedestrian Safety at Unsignalized Crossings. Transportation Research Board of the National Academies, Washington, DC.
2. Nee, J., and Hallenbeck, M. E. (2003). A Motorist and Pedestrian Behavioral Analysis Relating to Pedestrian Safety Improvements. (WA-RD 560.1). Olympia: Washington State Department of Transportation.
3. Hunt, J., and Abduljabbar, J. (1993). Crossing the road: A method of assessing pedestrian crossing difficulty. Traffic Engineering and Control, 34(11), 526–532.
4. Ullman, B., Fitzpatrick, K., and Trout, N. (2004). On-street pedestrian surveys of pedestrian crossing treatments. Proceedings of the ITE 2004 Annual Meeting and Exhibit.
5. Van Houten, R., Ellis, R. D., and Kim, J.-L. (2007). Effects of various minimum green times on percentage of pedestrians waiting for midblock “walk” signal. Transportation Research Record: Journal of the Transportation Research Board, 2002, 78–83.
6. FHWA. (2006). Federal Highway Administration University Course on Bicycle and Pedestrian Transportation. Lesson 12: Midblock Crossings. Retrieved July 2011 from http://www.fhwa.dot.gov/publications/research/safety/pedbike/05085/pdf/lesson12lo.pdf.
7. FHWA. (2023). Manual on Uniform Traffic Control Devices for Streets and Highways. Washington, DC.
METHODS TO REDUCE DRIVER SPEEDS IN SCHOOL ZONES
Introduction
Methods to reduce driver speeds in school zones refers to traffic control devices and pavement markings that are used to encourage drivers to drive at lower speeds in school zones. Maintaining safe speeds is particularly important in school zones for multiple reasons: (1) children have a greater tendency to behave unexpectedly near roadways than adults (1), (2) the probability of a pedestrian fatality rises from about 10% to approximately 60% when vehicle-impact speeds increase from 23 to 28 mi/h (2), (3) providing a reduced speed zone gives drivers a reduced stopping distance when forced to attempt to stop in reaction to a child, and (4) reduced driver speeds also provide safer gaps for children to cross the street (3). The application of the guidelines below can encourage slower driving and facilitate the safety of children in school zones.


Discussion
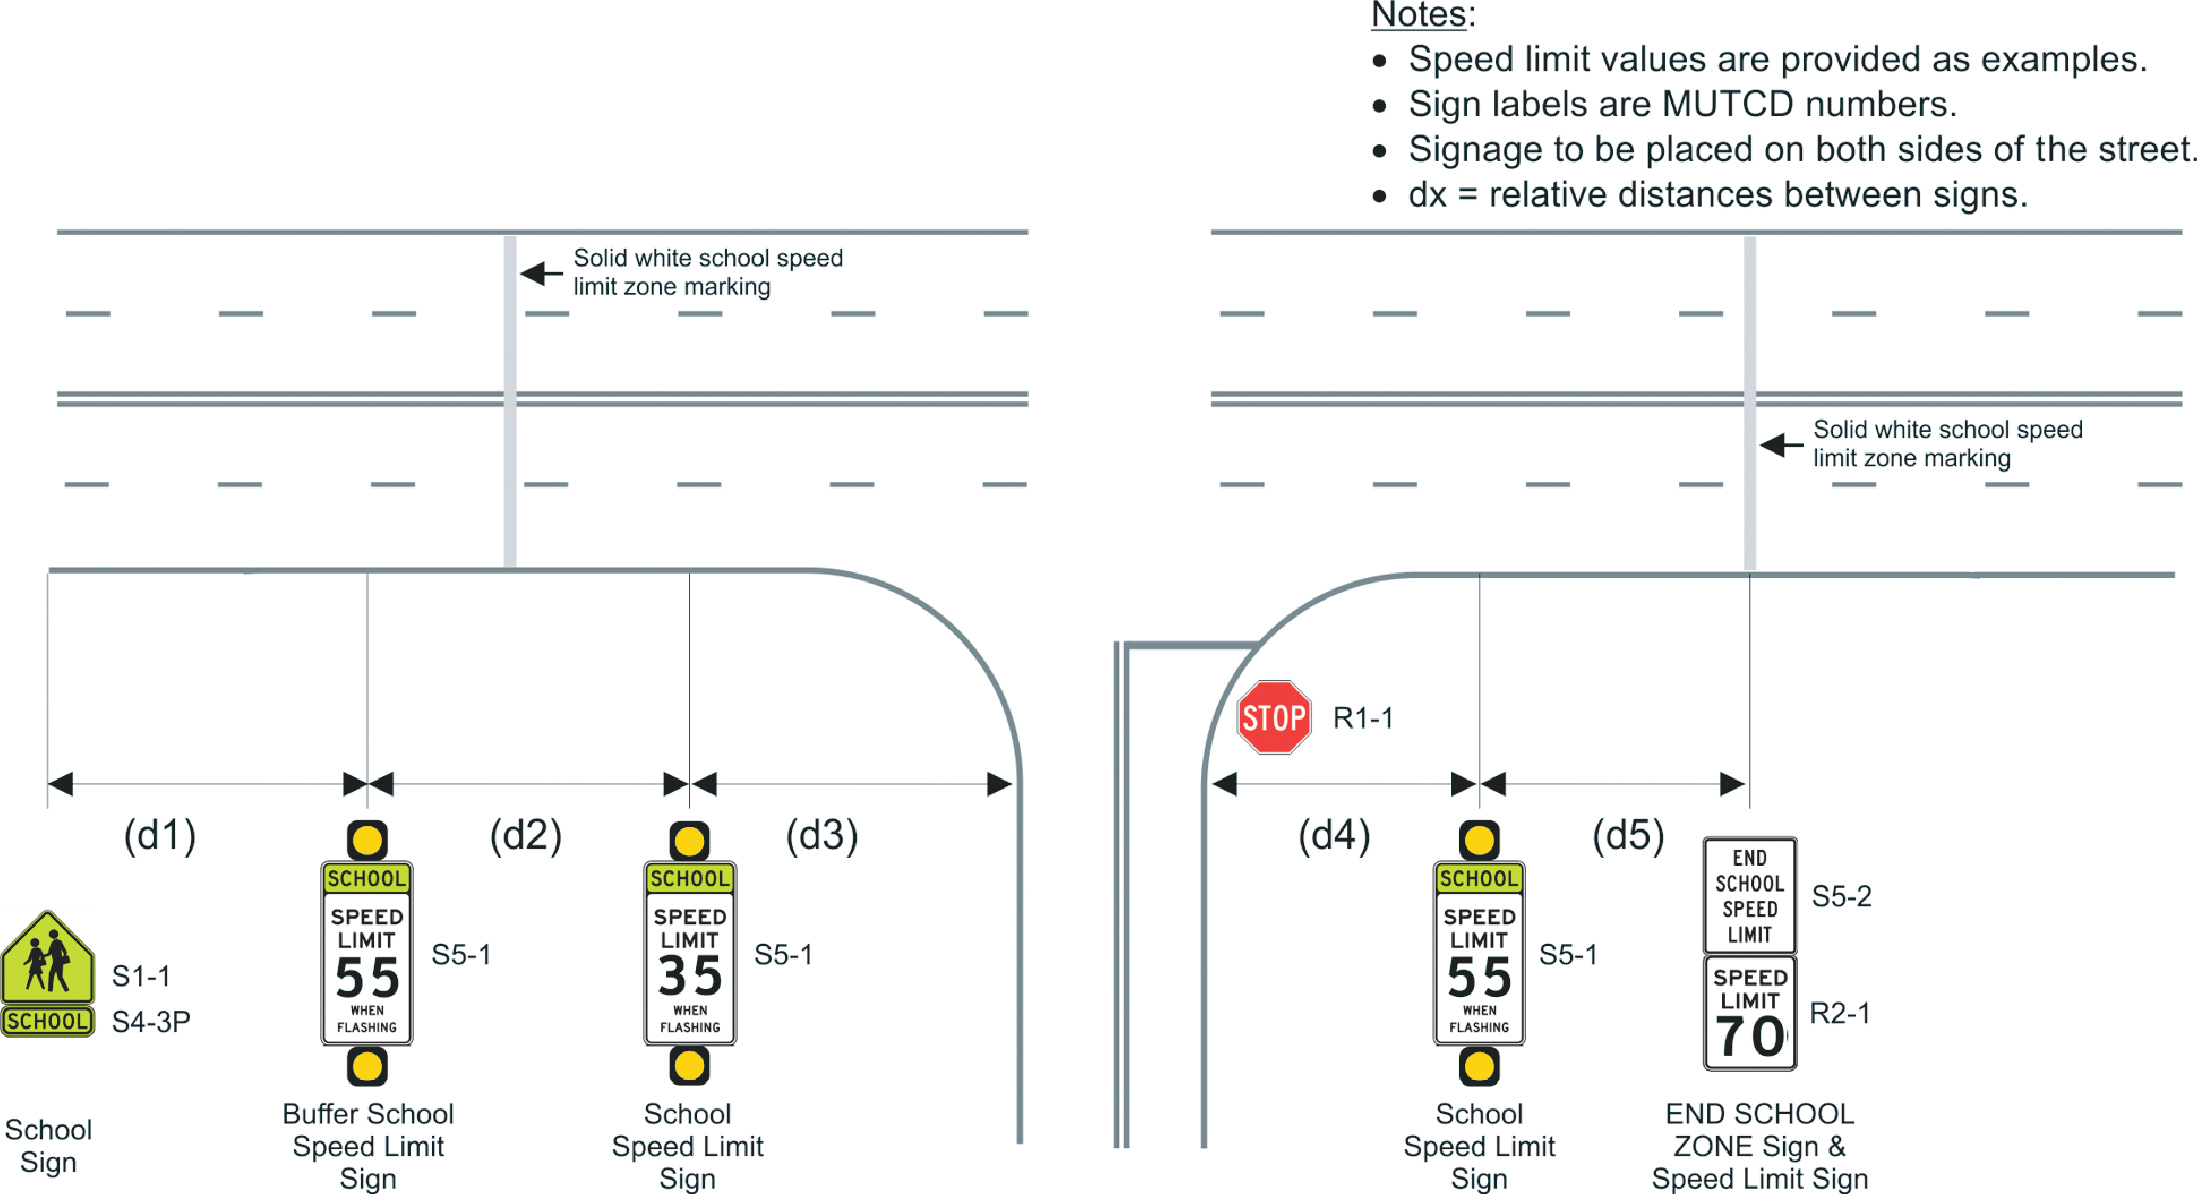
A key data source in this area and a key contributor to this guideline is Fitzpatrick et al. (4), in which a variety of methods were used to document existing knowledge and develop guidelines for school zone traffic control devices. Key methods included a literature review, a survey of practitioners on signing and marking practices, a telephone survey of law enforcement officers, and a review of state and local guidelines for school zones. The figure below (adapted from 4) shows key results for school zone speed limits (note that the speed limit signs are just provided as examples); note that d1–d5 are relative distances, and do not refer to any specific distances between the signs.
SCHOOL ZONE SPEED LIMITS
Source: Fitzpatrick et al. (4).
Long Description.
The road has solid white school speed limit zone marking. It has school sign (S1-1, S4-3P), buffer school speed limit sign (S5-1), school speed limit sign (S5-1), and end school zone sign (S5-2) and speed limit sign (R2-1). A line segment between the school sign and buffer school speed limit sign is labeled d1, a line segment between buffer school speed limit sign and school speed limit sign is labeled d2. A line segment between the school speed limit sign and an intersection is labeled d3. A line segment between an intersection and a school speed limit sign is labeled d4. A line segment between the school speed limit sign and the end school zone and speed limit signs is labeled d5. Notes for the figure read: Speed limit values are provided as examples. Sign labels are MUTCD numbers. Signage to be placed on both sides of the street. dx = relative distances between signs.
Design Considerations
The effectiveness of school zone flashers on vehicular speed is unclear. Aggarwal and Mortensen (6) found a significant reduction in vehicle speeds with the use of advance school flashers. When Hawkins (7) tested the beacons on school zones along highways, however, the speed differences were limited. One benefit mentioned by Hawkins (7) and observed by Hawkins (8) on speed limit signs is that flashers also serve the purpose of indicating when the school zone is active.
Cross References
Speed Perception, Speed Choice, and Speed Control, Chapter 14
Methods to Increase Driver Yielding at Uncontrolled Crosswalks
Task Analysis of Rail-Highway Grade Crossings
Key References
1. Tay, R., and Li, S. J. (2008). Driversʼ perceptions and reactions to chain link fence. 87th Annual Meeting of the Transportation Research Board.
2. Saibel, C., Salzberg, P., Doane, R., and Moffat, J. (1999). Vehicle speeds in school zones. ITE Journal, 69(11), 38–42.
3. Saito, M., and Ash, K. G. (2005). Evaluation of Four Recent Traffic Safety Initiatives, Volume IV: Increasing Speed Limit Compliance in Reduced Speed School Zones. (Report UT-05.13). Salt Lake City: Utah Department of Transportation.
4. Fitzpatrick, K., Brewer, M. A., Obeng-Boampong, K., Park, E. S., and Trout, N. D. (2009). Speeds in School Zones. (FHWA/TX-09/0-5470-1). College Station: Texas Transportation Institute.
5. Lee, C., Lee, S., Choi, B., and Oh, Y. (2006). Effectiveness of speed-monitoring displays in speed reduction in school zones. Transportation Research Record: Journal of the Transportation Research Board, 1973, 27–35.
6. Aggarwal, G. C., and Mortensen, S. L. (1993). Do advance school flashers reduce speed? ITE Journal, 63(10), 24–30.
7. Hawkins, N. R. (1993). Modified signs, flashing beacons and school zone speeds. ITE Journal, 63(6), 41–44.
8. Hawkins, H. G. (2007). Rear-facing school speed limit beacons. ITE Journal, 77(6), 18–23.
SIGNAGE AND MARKINGS FOR HIGH OCCUPANCY VEHICLE LANES
Introduction
Managed and reserved lanes are lanes usually designed for roadway networks in highly congested metropolitan regions where high occupancy vehicles (HOV) are promoted and maintained as part of a network freeway management program. AASHTO defines an exclusive HOV roadway as “an entire highway facility reserved at all times solely for the use of buses or buses and other HOVs. This facility offers buses and HOVs a high level of service, improves schedule reliability and operating speeds, and decreases travel time for the users” (1). Other HOV roadways are only exclusive during certain hours of the day. These lanes have various restrictions that do not apply to the normal travel lanes. The signage and markings used to describe these lanes are essential for motorists to understand usage rules and the special nature of the lane.

Discussion
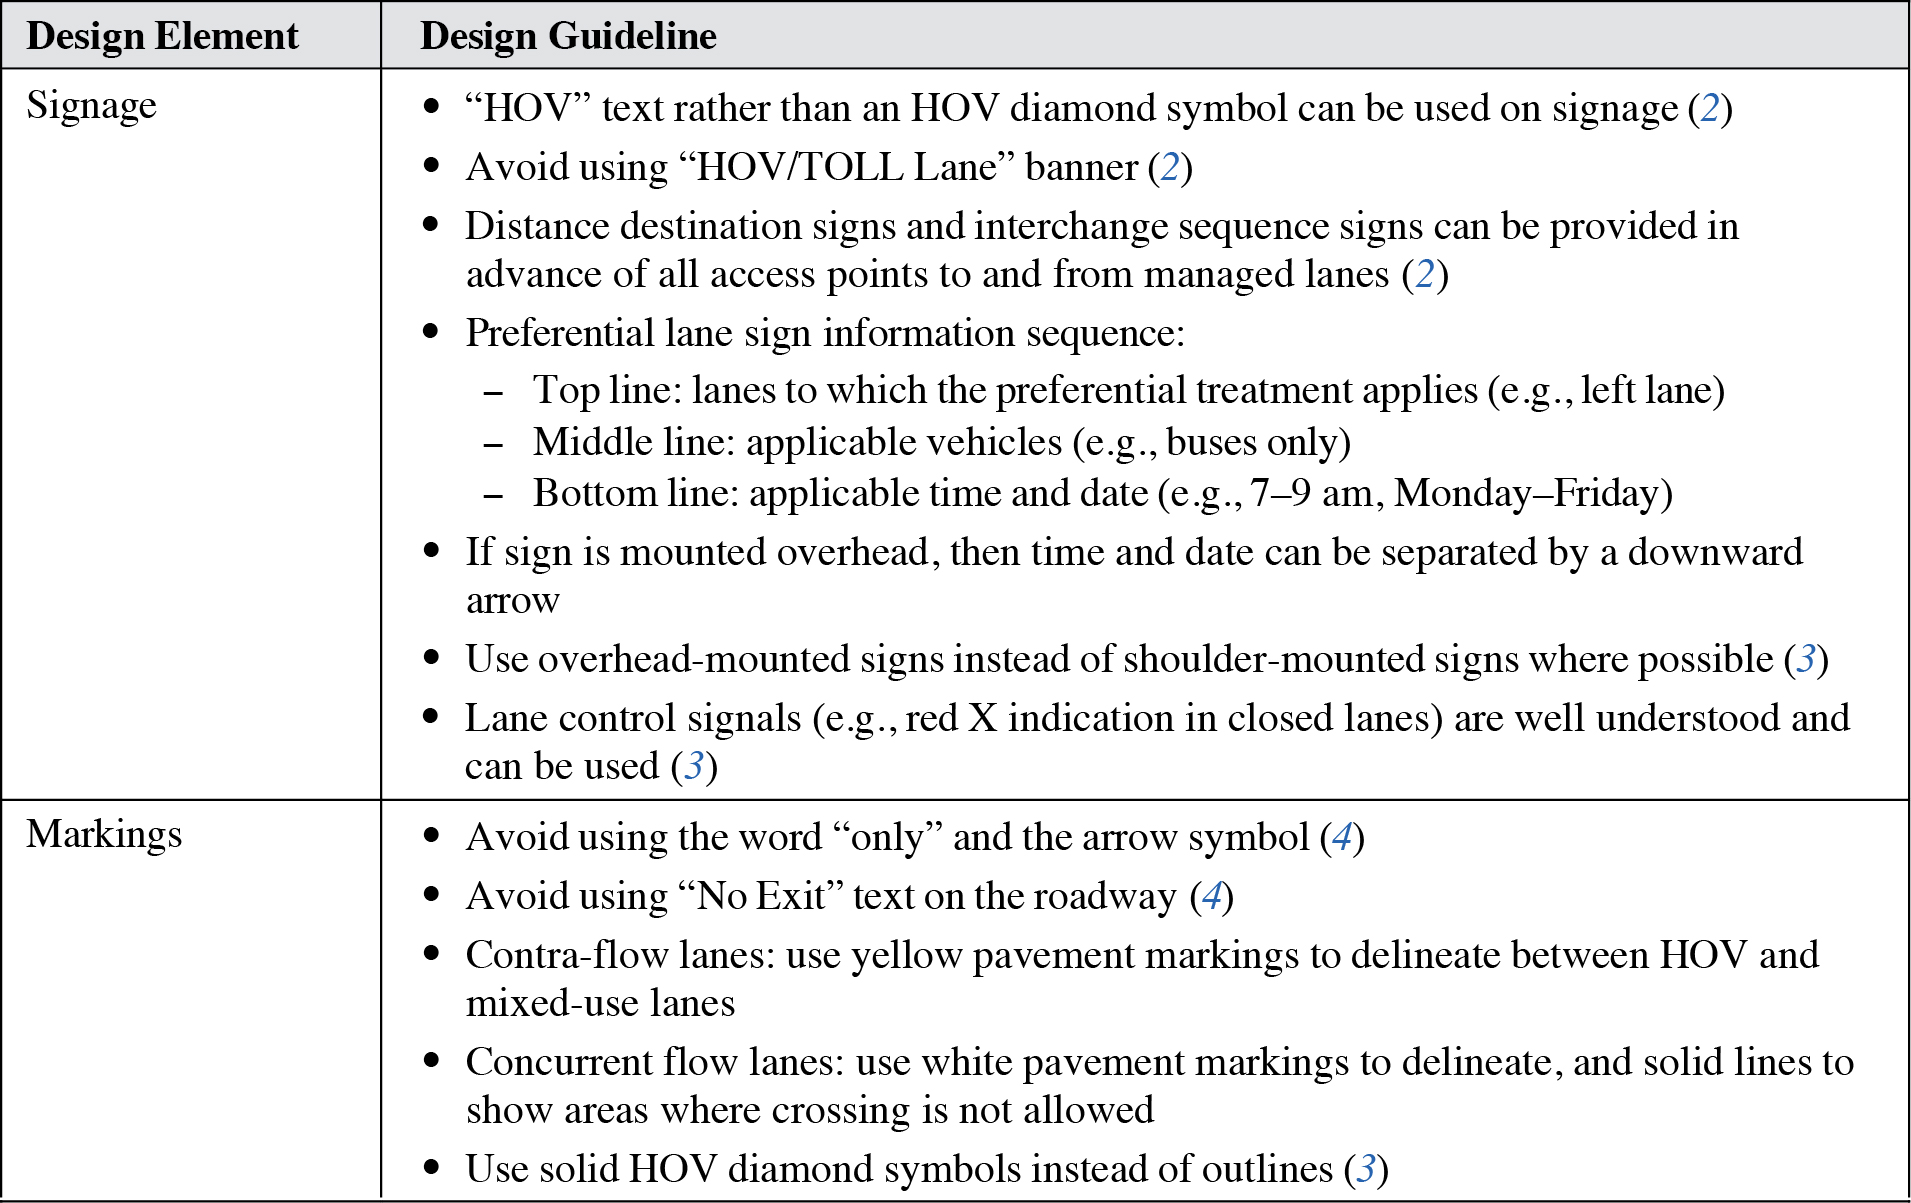
There are relatively few data sources that can be used to develop comprehensive guidelines on this topic. The studies by Chrysler (2, 4) provide the best available data for the design of signs and markings, and the guidelines shown rely quite heavily on these laboratory studies. In Chrysler (2), computer-based surveys were used to obtain data from 142 drivers in Texas. The surveys used video animations and still images of signs to assess driver comprehension of managed lane signs that presented information related to pricing, occupancy, and destinations. Although there were some methodological concerns about the legibility of the animations used, the study yielded useful information on the characteristics of managed lane signs that seem to be associated with the highest levels of comprehension. For example, Chrysler found that letters “HOV” were better understood than the diamond symbol. Drivers also showed low comprehension with the “HOV/TOLL Lane” banner. Half of the respondents incorrectly understood the banner to mean that only carpools are allowed, and that carpools must pay a toll. This misunderstanding would prevent toll-paying single-occupant vehicle drivers from entering the lane when they were actually allowed. Also, the HOV diamond symbol in the corner of the sign is still misunderstood by 15–25% of drivers to mean “Official Vehicles Only.” The text “HOV” was well understood by over 90% of participants (2).
Advanced destination signing is an important determinant of whether drivers will use a managed lane. Previous studies show that one of the main reasons drivers do not enter HOV lanes is uncertainty about destinations served. Chrysler found that distance destination signs and interchange sequence signs should be provided in advance of all access points to and from managed lanes. Interchange sequence signs for managed lane exits may need to be made more distinct to avoid confusion with signing for the general-purpose lanes (2).
Design Considerations
A key topic in the design of managed lanes is whether the lanes will offer limited access or continuous access. Jang and Chan conducted an in-depth statistical evaluation of the differential safety performance exhibited by these two types of HOV facilities (5). When compared with HOV lanes in continuous-access facilities, HOV lanes in limited-access facilities experienced a higher percentage of collisions compared with other lanes, a higher number of total collisions per mile per hour, and a higher number of severe collisions per mile per hour; also, the collision rates measured by traffic volume (per million vehicles traveled) offer the same differential in performance. The differential for left lanes (this refers to the left-most non-HOV lane, i.e., the lane to the immediate right of the HOV lane) was somewhat different from the pattern for HOV lanes. Compared with left lanes in continuous-access facilities, left lanes in limited-access facilities had a higher percentage of collisions and a higher overall collision rate, but a lower rate of severe collisions (5).
Cross References
Key References
1. AASHTO. (2018). A Policy on Geometric Design of Highways and Streets (7th ed.). Washington DC.
2. Chrysler, S. T., and Nelson, A. A. (2009). Driver Comprehension of Managed Lane Signing. (FHWA/TX-09/0-5446-3). College Station: Texas Transportation Institute.
3. McGhee, C. C. (1998). Traffic Control for High Occupancy Vehicle Facilities in Virginia. (VTRC 98-R25). Charlottesville: Virginia Transportation Research Council.
4. Chrysler, S. T., Williams, A. A., and Fitzpatrick, K. (2008). Driver Comprehension of Signing and Markings for Toll Facilities. (FHWA/TX-08/0-5446-2). College Station: Texas Transportation Institute.
5. Jang, K., and Chan, C.-Y. (2009). High-occupancy-vehicle lane configurations and safety performance of California freeways: Investigation of differential distributions and statistical analysis. 88th Annual Meeting of the Transportation Research Board.
SIGHT DISTANCE CONSIDERATIONS FOR URBAN BUS STOP LOCATIONS
Introduction
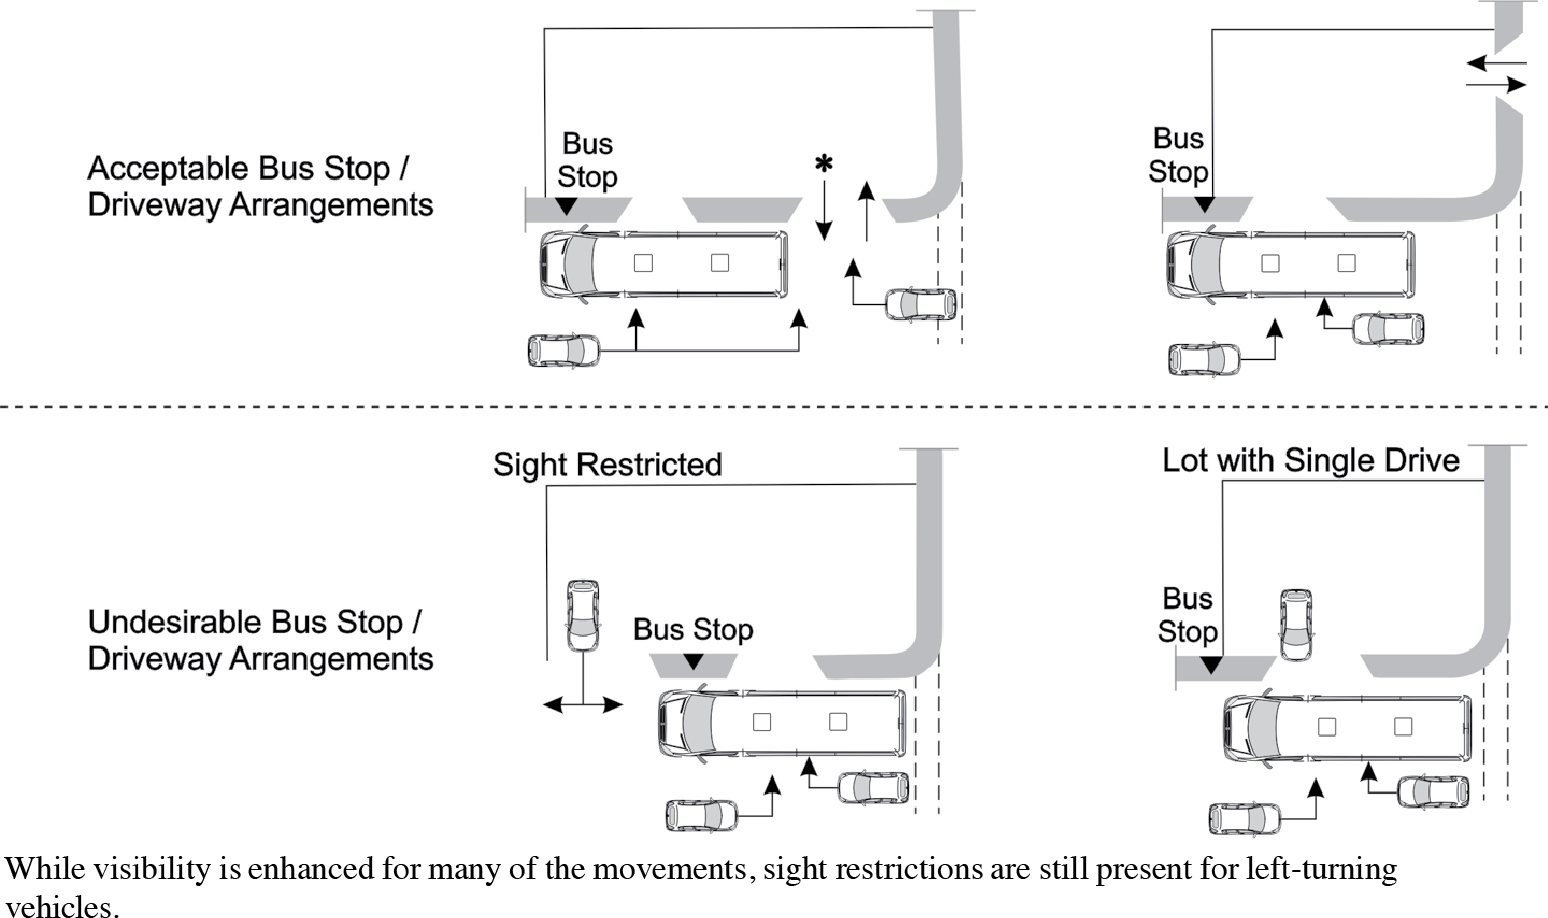
Sight distance considerations for urban bus stop locations refers to sight line issues that stem from the placement of urban bus stops. Bus stop placement and design are dependent on a multitude of factors including vehicle delays, bus delays, pedestrian waiting areas, cost, safety, and others. Two percent of all pedestrian collisions in urban areas occur at bus stops (1), primarily because the bus obstructs the view of oncoming vehicles and the pedestrians who cross in front of the bus. This guideline discusses the issues related to sight distance and visibility at bus stops.

Source: Recreated from Texas Transportation Institute (2).
Long Description.
The first two illustrations show the acceptable bus stop and driveway arrangements. The bus stop is located before an exit and on the side of an exit. The third and fourth illustrations show the undesirable bus stop and driveway arrangements. They are sight restricted and have a lot with a single drive.
Discussion
One of the factors that contributes to bus collisions with vehicles or pedestrians is sight distance or sight lines that do not provide enough time for road users to perceive and react to hazards. A review of pedestrian safety research (1) concluded that 2% of pedestrian collisions in urban areas occurred at bus stops. Most of these collisions did not occur between a pedestrian and a bus; rather, the bus created a visual barrier between the approaching vehicles and the pedestrians who crossed in front of the bus. In addition, visual obstructions outside of the bus, such as signs, shrubbery, wide columns, and other obstacles, may block the bus operatorsʼ view of pedestrians (4). A bus stop that is set back too far from the curb for the operator to see pedestrians may lead pedestrians to encroach into the roadway in an attempt to be more visible. Finally, a lack of lighting can reduce the visibility of pedestrians both at bus stops and while crossing the street to approach or leave the bus stop.
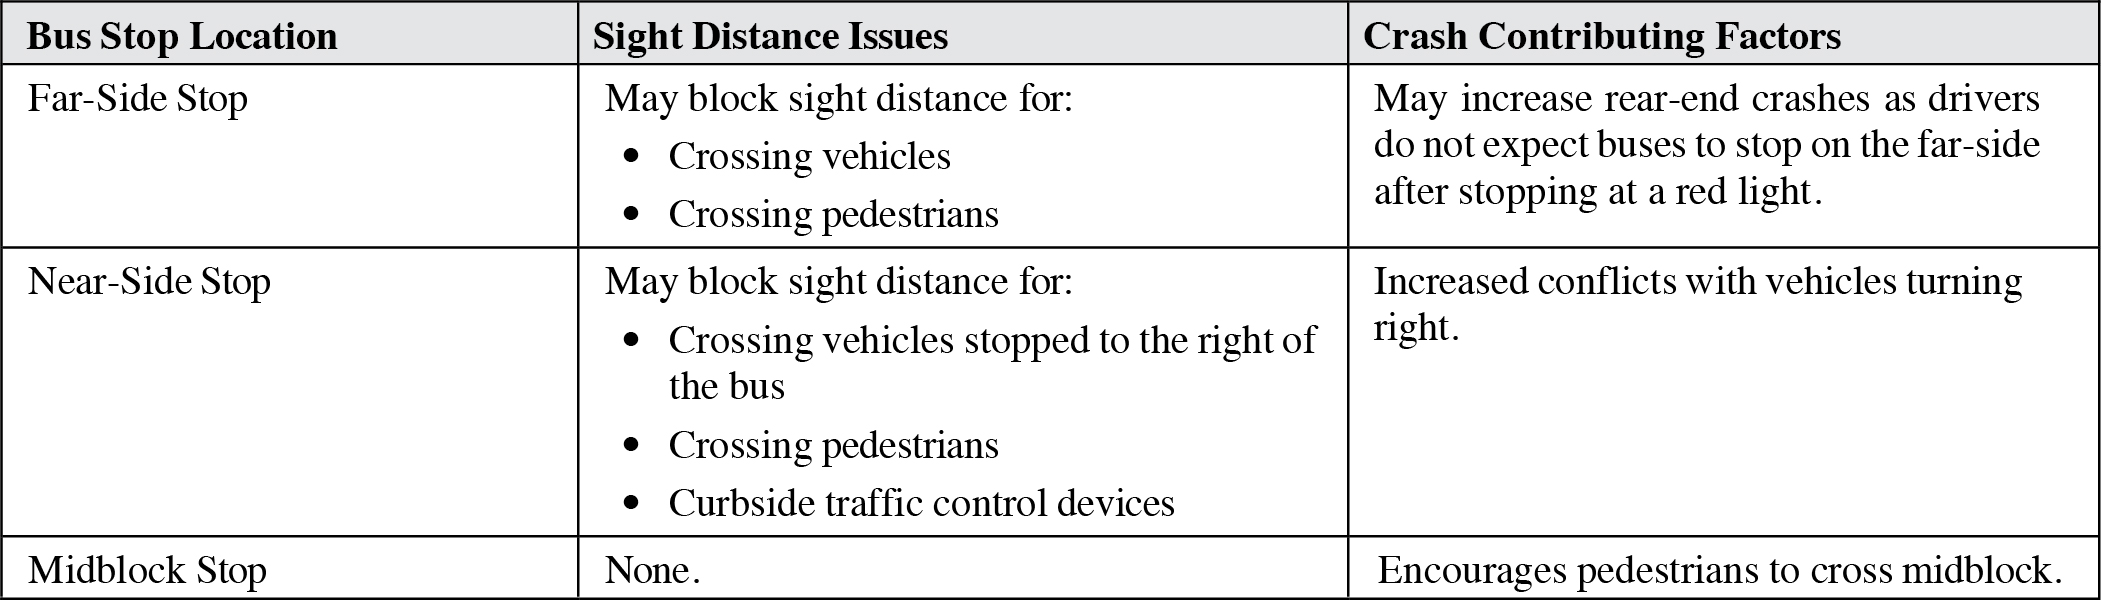
Many factors affect the decision about whether to place a bus stop at the near or far side of an intersection, or at midblock. Several studies (e.g., 5, 6) suggest that far-side bus stops can enhance pedestrian safety by eliminating sight distance restrictions associated with the stopped bus, primarily because they make pedestrians more visible to motorists approaching from behind the bus—with these bus stops, pedestrians are encouraged to cross the street behind the bus rather than in front of the bus. Also, far-side stops are less likely to obscure motoristsʼ view of traffic signals, and pedestrians, and they reduce conflicts between buses and right-turning vehicles (3). However, the number of rear-end crashes may increase because drivers may not expect buses to stop on the far side after stopping at a red light.
Near-side stop locations require alighting passengers to cross the street in front of the bus, which can obscure the sight lines from surrounding vehicles to the pedestrians. Also, the buses can block right-turning motoristsʼ sight lines to pedestrians or slow-moving vehicles in the cross street. However, near-side stops can be effective where there are not heavy volumes of right-turning vehicles at the intersection. The guidelines in Texas Transportation Institute (2) recommend that bus bays should be avoided for near-side bus stops because they are likely to obstruct sight distance to traffic control devices and pedestrians.
The guidance in Metcalf and Bond (3) suggests that, although there are generally no sight distance issues with midblock bus stops, these locations should be used when the use of near-side and far-side stop locations are not feasible due to safety considerations at the intersection other than sight distance.
Design Considerations
Bus stop design should guide alighting passengers to cross the road from behind the bus rather than from in front of the bus, which would enable passengers to see the oncoming traffic (6). In addition, pedestrians and commuters should be guided not to walk near the bus or cross the road by walking near the bus, because it is difficult for bus drivers to see pedestrians in these areas. Some mitigation strategies that improve sight distance and pedestrian visibility include signing, striping, bus turnouts located such that alighting passengers have a clear view of the approaching traffic, crosswalks, and channelized pedestrian movement to crosswalks.
Cross References
Methods to Increase Driver Yielding at Uncontrolled Crosswalks
Key References
1. Campbell, B. J., Zegeer, C. V., Huang, H. H., and Cynecki, M. J. (2004). A Review of Pedestrian Safety Research in the United States and Abroad. (FHWA-RD-03-042). McLean, VA: FHWA.
2. Texas Transportation Institute. (1996). TCRP Report 19: Guidelines for the Location and Design of Bus Stops. TRB, National Research Council, Washington, DC.
3. Metcalf, D. D., and Bond, V. L. (2006). Bus stop guidelines to meet urban, suburban and rural conditions. In ITE 2006 Technical Conference and Exhibit Compendium of Technical Papers.
4. Pecheux, K. K., Bauer, J. K., Miller, S., Rephlo, J. A., Saporta, H., Erickson, S., Knapp, S., and Quan, J. (2008). TCRP Report 125: Guidebook for Mitigating Fixed-Route Bus-and-Pedestrian Collisions. Transportation Research Board of the National Academies, Washington, DC.
5. Technology and Management Systems, Inc. (2001). TCRP Report 66: Effective Practices to Reduce Bus Accidents. TRB, National Research Council, Washington, DC.
6. Pulugurtha, S. S., and Vanapalli, V. K. (2008). Hazardous bus stop identification: An illustration using GIS. Journal of Public Transportation, 11(2), 65–83.
GENERAL DESIGN CONSIDERATIONS FOR URBAN BUS STOPS
Introduction
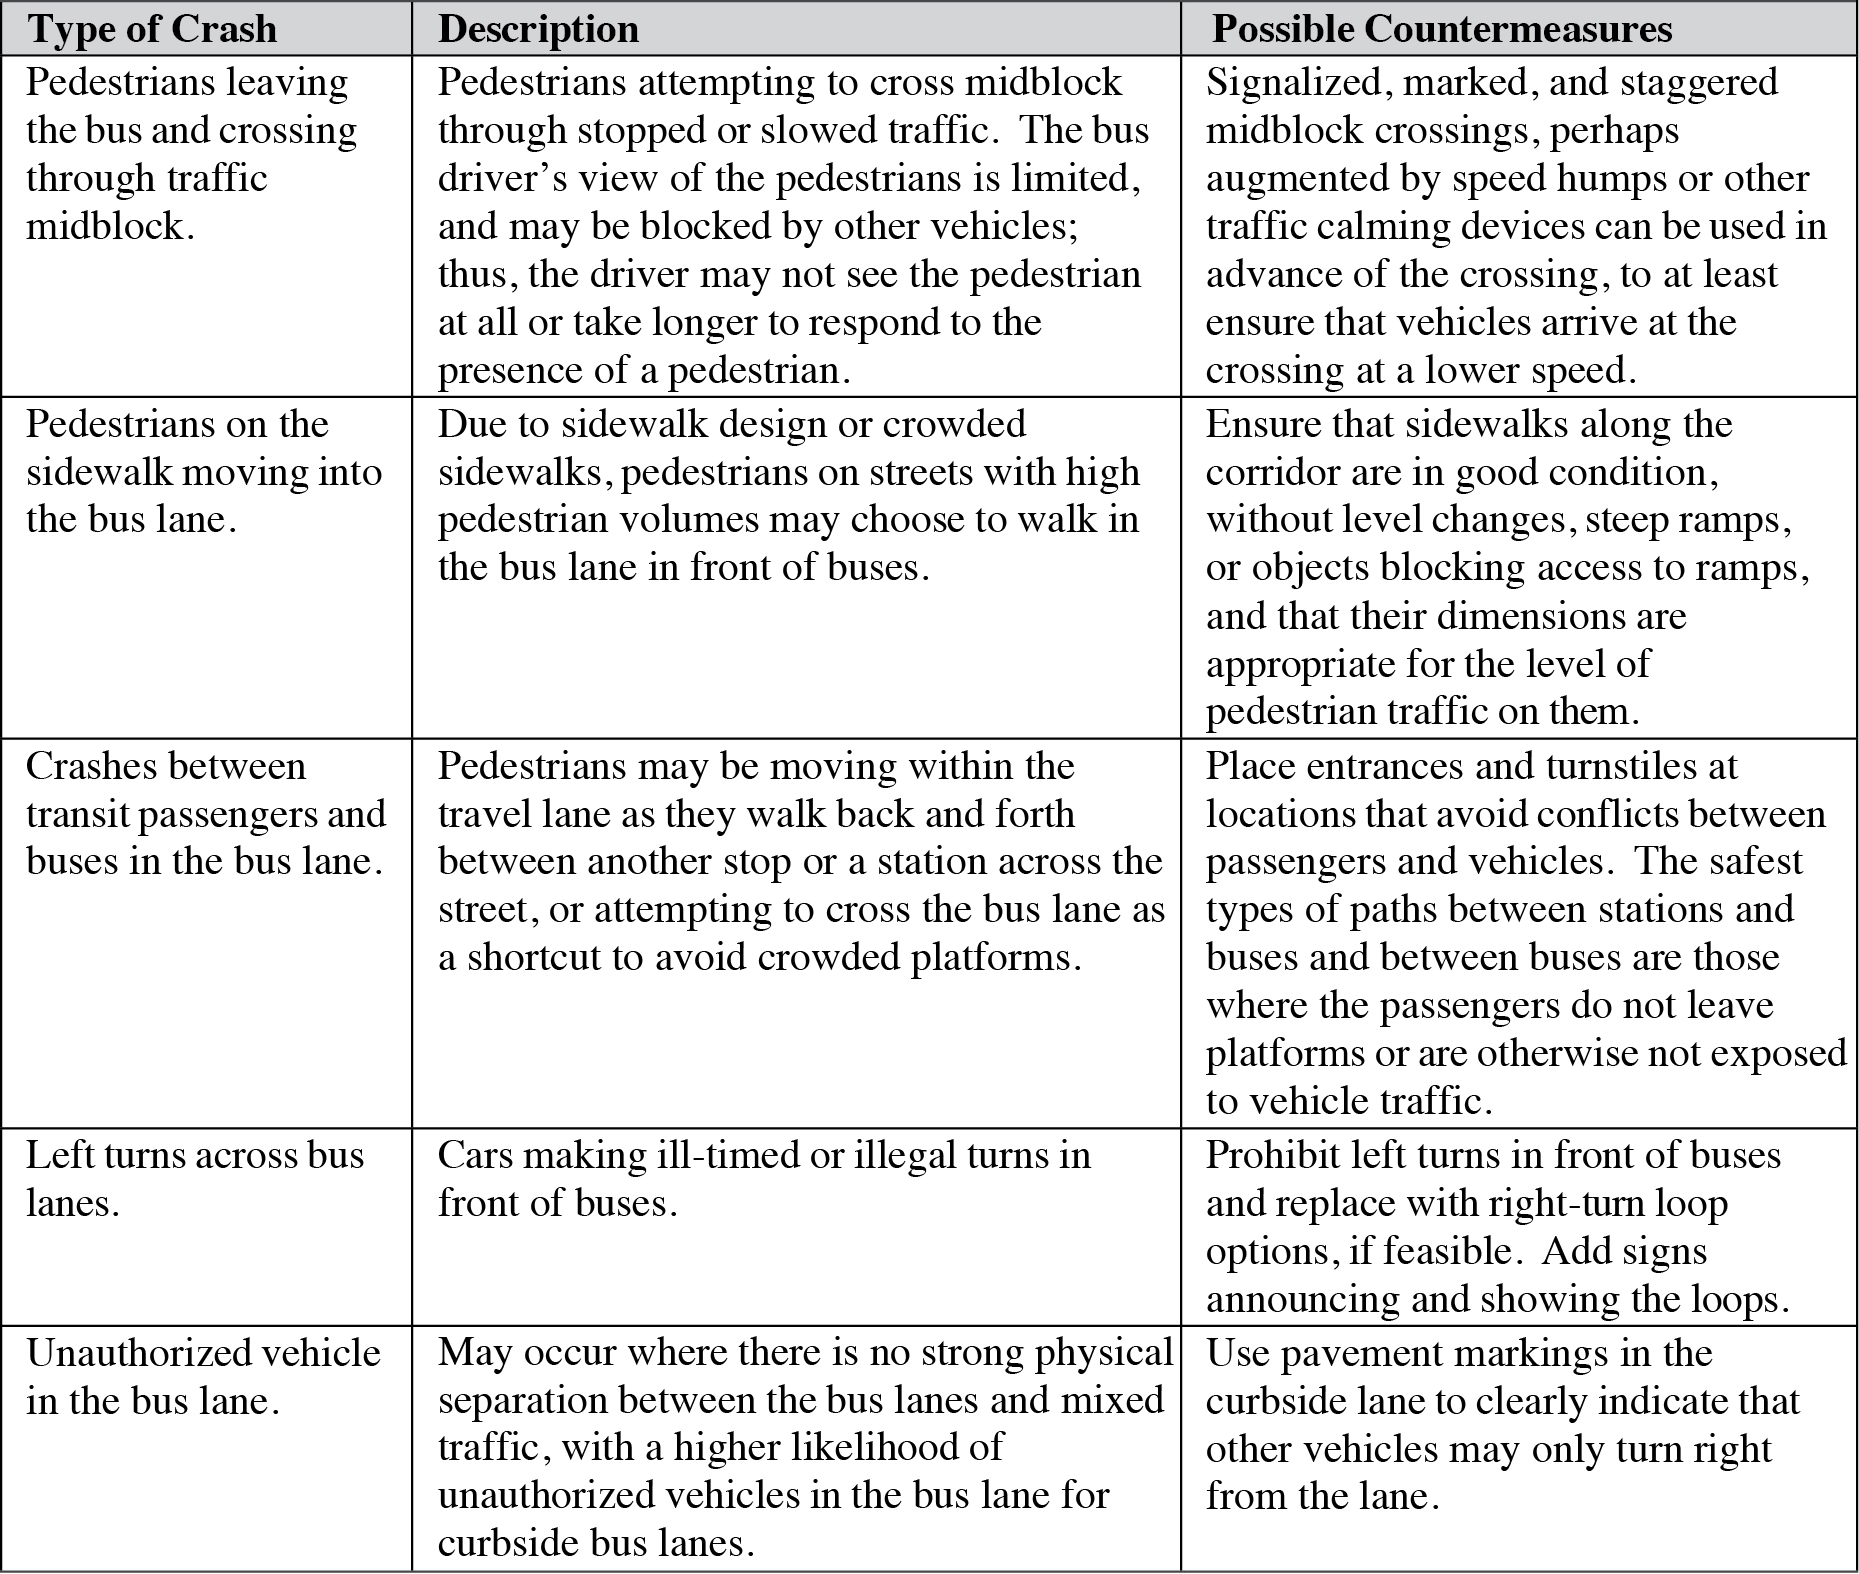
This guideline provides an overview of safety performance at bus stops and discusses some roadway treatments that can be used to reduce crash potential at or near bus stops. Crashes can occur at or near bus stops in a number of ways and for a variety of reasons. While bus-to-other vehicle crashes certainly take place, bus-to-person crashes, which include crashes with pedestrians, bicyclists, and people using other micromobility devices, remain a key safety focus because of the severity of the outcomes of such crashes. According to the FTA, from 2008 to 2021, transit agencies reported 7,298 bus-to-person collisions to the National Transit Database, which resulted in 537 fatalities (approximately 15 percent of all transit fatalities) and 7,329 injuries (1). The guidelines below [source: (2)] describe and provide possible countermeasures for both bus-to-person crashes as well as bus-to-vehicle crashes.

Discussion
As discussed in Chapter 24, driver behavior issues are a key contributor to pedestrian crashes (3). While alcohol is frequently involved in pedestrian crashes, other characteristics of fatal pedestrian crashes are associated with interactions between road users and the environment: 84 percent occurred in urban areas, 75 percent occurred outside of intersections, and 77 percent occurred in the dark, per 2021 data. The FTA analyzed the details on bus crashes from 2017 through 2021 and reported that (1):
- The largest proportion of injuries and fatalities from bus-to-person collisions occurred at roadway intersections (42 percent), as compared to the midblock of roadways (38 percent), bus stops (15 percent), and all other locations (5 percent).
- Approximately 53 percent of crosswalk pedestrian injuries and fatalities occurred when the bus turned left, compared to turning right or proceeding straight.
- Of the crashes causing fatalities and injuries that occurred at the midblock of roadways, approximately 32 percent were with bicyclists, and 30 percent were with non-crosswalk pedestrians. At the midblock of the roadway, collisions with bicyclists predominantly occurred on the side of the bus, while non-crosswalk pedestrians were predominantly struck head-on by the bus.
Key issues associated with bus crashes include: (1) reduced visibility between the bus driver and the roadway environment due to vehicle elements (e.g., A-pillars, mirrors), or roadway elements (e.g., signs, other vehicles), (2) entry into the bus path by pedestrians, bicyclists, and other road users, and (3) limited space at bus stops and adjacent sidewalks, which increases opportunities for conflicts and may reduce available response time to respond to hazards (1).
Duduta et al. (2) conducted a review of transit safety using data analyses, road safety audits, and on-site inspections and identified main risk factors, common crash situations, and possible treatments to improve transit safety. Their report addresses a range of system and corridor types, including curbside bus priority lanes, high-capacity, multilane, and median-running buses, and multiple crash scenarios.
The New Jersey Bicycle and Pedestrian Resource Center (4) conducted an extensive review of crashes at or near bus stops in New Jersey. The findings of the site-level analysis showed that motorists were primarily responsible for the majority of crashes, with “Left Turn Parallel Path” and “Motorist Failed to Yield” crashes being the most common crash types. Bus stop location was also found to be a contributing factor, with near-side stops more closely associated with crashes than far-side stops.
Design Considerations
Due perhaps to the complexity and multimodal nature of many roadway locations with bus stops, any relevant treatments should be carefully examined for possible unintended consequences before implementation. Duduta et al. (2) noted that in one case study, prohibiting left turns at nearby intersections to reduce conflicts with buses redirected traffic through adjacent neighborhoods and shifted crashes to other nearby locations.
Sociological influences might be important as well; the New Jersey study (4) noted that “The perception of crime is more important and concerning to those at high-risk bus stops than traffic safety.” They found that crime and safety perception issues may not be lessened by increased police presence. Instead, improved service information may help decrease the amount of wait time passengers have at bus stops, therefore lessening their exposure to potentially dangerous persons.
Cross References
Sight Distance Considerations for Urban Bus Stop Locations
Key References
1. FTA. (2023). Bus-to-person collisions. (SA-23-1). Federal Transit Administration, Washington, DC.
2. Duduta, N., Adriazola-Steil, C., Wass, C., Hidalgo, D., Lindau, L. A., and Sam John, V. (2015). Traffic Safety on Bus Priority Systems. Washington, DC: World Resources Institute.
3. National Center for Statistics and Analysis. (2023). Pedestrians: 2021 Data. (Traffic Safety Facts. Report No. DOT HS 813 458). Washington, DC: NHTSA.
4. New Jersey Bicycle and Pedestrian Resource Center. (2014). Pedestrian Safety at Bus Stops Study. Rutgers University; New Brunswick, NJ: Rutgers, The State University of New Jersey.
This page intentionally left blank.


